Chart of the Day: FTSE 100

It always concerns me when the mainstream media, in the form of financial journalists, start doing their own technical analysis/charting. Usually it concerns Heads & Shoulders, or Golden/Dead Crosses, but the latest manifestation is the RSI on the FTSE 100 hitting “overbought.”
FTSE 100: RSI Sell Signal?
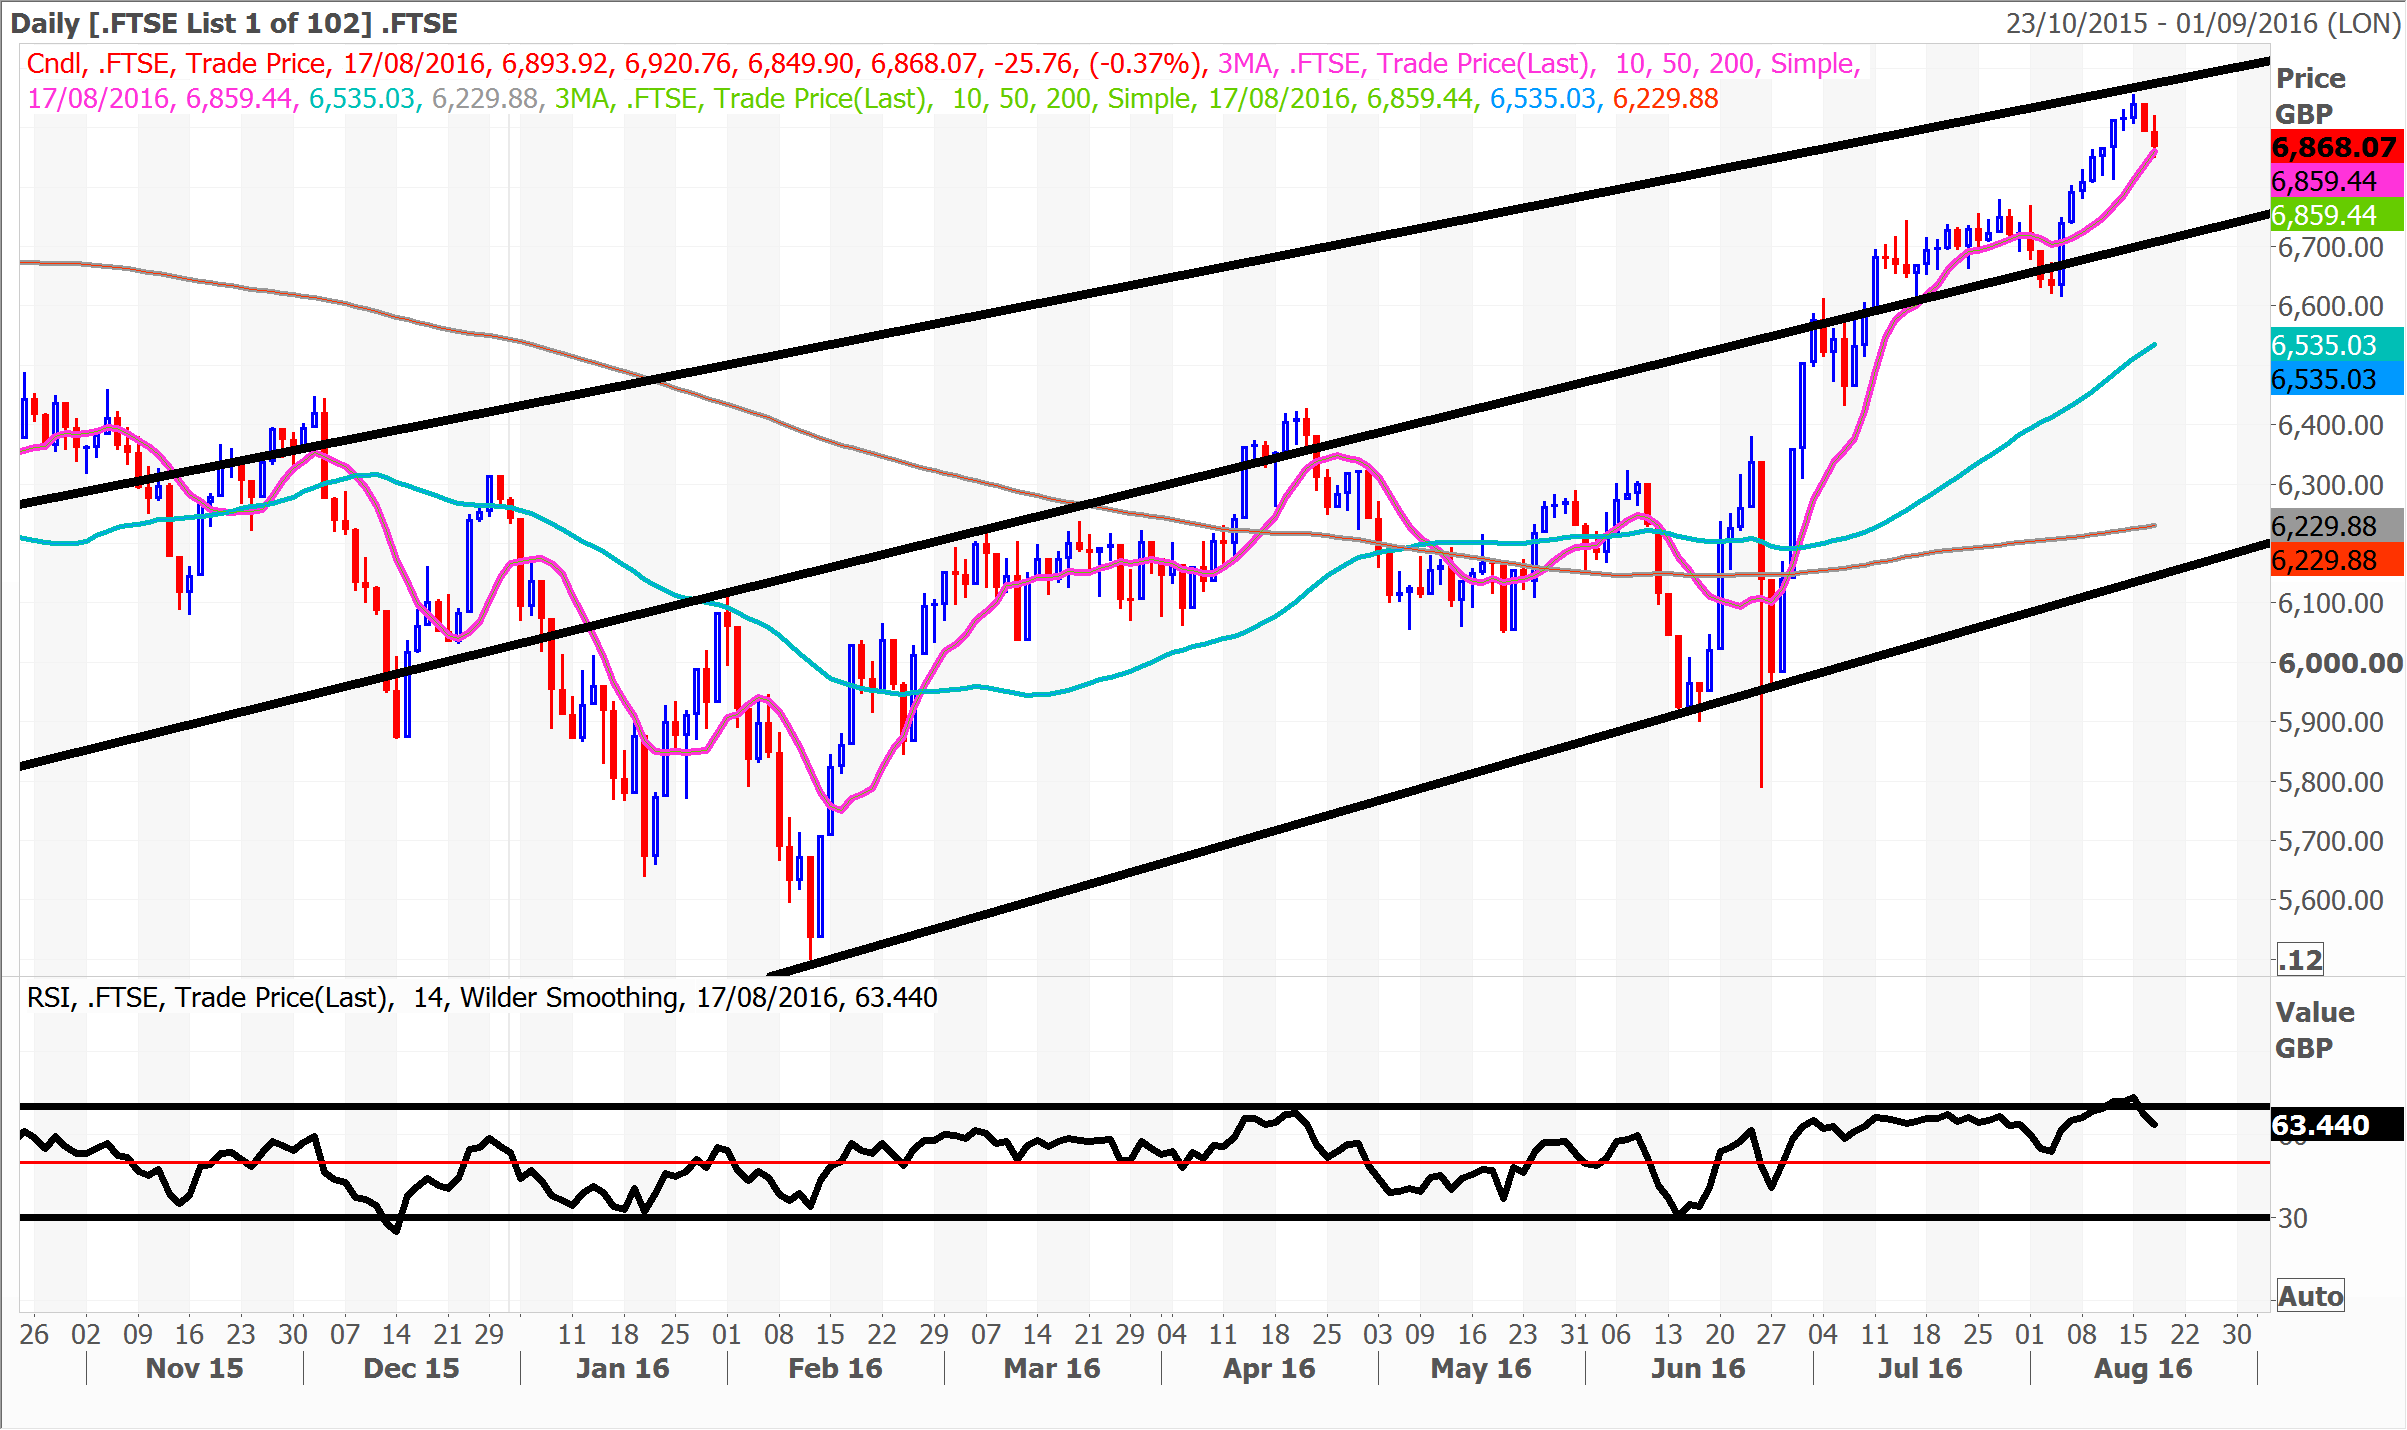
It is difficult not to imagine there is a “hidden” agenda behind all the amateur technical analysis in the press, given that a pillar of the Remain camp was claiming that not only would Sterling collapse – as it has – but also that the stock market would tank. Unfortunately, most commentators do not understand that a weaker Pound is great news, and has helped to boost the Dollar earners in the FTSE 100. The main point here is actually that, having got it wrong in terms of the nightmare scenario that Brexit winning, they are determined to get their way, even if they have to drag in the rather obscure science of price action. On the Relative Strength Index scale it is traditionally the case readings over 70/100 that are overbought and hence a sell opportunity, while 30/100 is the buying zone. However, as seasoned market participants will be aware, in strongly trending situations the RSI can head into extreme territory without any significant reversal for an extended period of time. In addition, the retreat from overbought can just be 50–100 points before an even stronger break to the upside.
All of this brings us to where we are at the moment on the UK index, with a retreat to the 10 day moving average at 6,859. Above this we should still see the implied 7,000 plus breakout, with only a move back below an autumn uptrend line at 6,700 questioning the ongoing post-Brexit rally from a technical basis.

Comments (0)