Chart of the Day: Centrica

As far as British Gas owner Centrica is concerned, it may be the case that the saying “don’t get mad, get even” is the appropriate one. The question is whether getting even should involve going long of the shares?
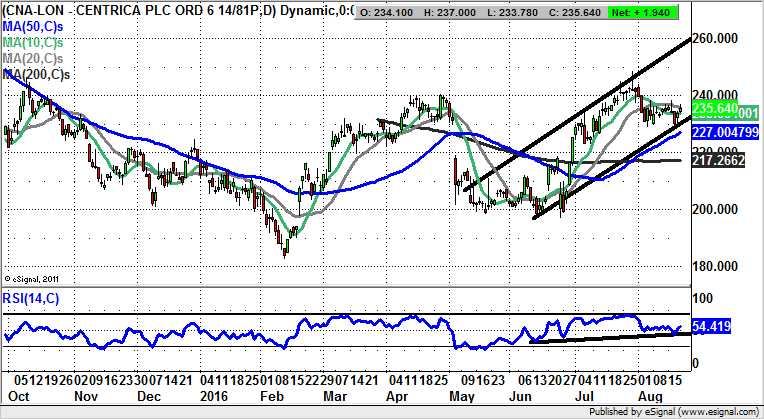
Centrica (CNA): Gap Higher Through 50 Day Line Targets 260p
The recent trajectory of the daily chart of Centrica is a standout on the basis that we have been treated to several gaps to the upside and downside. Overall though, it would appear that the bulls have it, in the sense that there has been an extended basing since the autumn. The starting gun was arguably the bear trap gap reversal in February from below the former 201p December low. Since then we have been witnessing a false start rally from February kicked off by a gap through the 50 day line, and then the latest rebound – also started from a gap through the 50 day moving average, currently unfilled, which was made in June. All of this leads us to the present setup where there is progress within a rising trend channel drawn from May. The floor of the channel is backed by the 50 day moving average at 227p. Above this on an end of day close basis the upside here could be the 2016 resistance line projection at 260p over the next 1-2 months.
Comments (0)