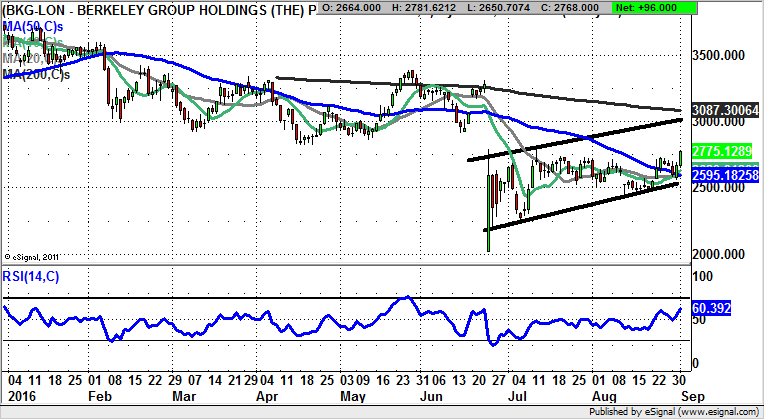
Chart of the Day: Berkeley Group

The occasion for looking at the charting position of Berkeley Group is the demotion of the housebuilder from the FTSE 100. Normally, this is portrayed in the financial media as being a negative for a stock, but this may not be the case here.
Berkeley Group (BKG): June Price Channel towards 3,000p
The housing market continues to be the staple of dinner party conversation, especially given that it is of course not polite to discuss religion or politics at such gatherings. The irony of course is that people probably have more faith in the ability for house prices to go up than any higher power, and that real estate and politics are deeply connected. Indeed, cynics such as myself might suggest the only reason that Mark Carney became Governor of the Bank of England (apart from his being best buddies with George Osborne) was to create a housing bubble at all costs. In the wake of the latest (needless) interest rate cut and QE in August, there is every chance of the bubble continuing to inflate, Brexit or Brexit Lite. As far as the implications for the share price of Berkeley Group, it is normally the case that a demoted FTSE 100 stock will rally at the beginning of its life in the FTSE 250, a possible state of affairs which would appear to be in line with the present charting configuration. What is evident here is the way the shares have been recovering within a rising trend channel which can be drawn in on the daily chart since as long ago as the end of June. The resistance line projection of the channel is currently pointing as high as 3,000p, just below the 200 day moving average at 3,087p, an area which is expected to be hit by the end of this month. The stop loss is an end of day close back below the 50 day moving average at 2,595p.

Comments (0)