Chart of the Day: Barclays

It is perhaps somewhat difficult to work out why, or how the leading UK banks seem to be on the front foot as far as their price action is concerned, but perhaps the best thing here is not to reason why?
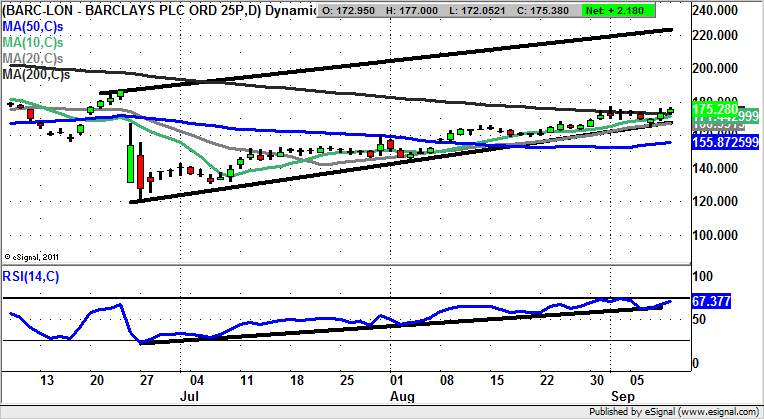
Barclays (BARC): 200 Day Line Break Could Lead To 220p
It may be said that as far as the drugs sector, there is nothing more intriguing than a combination of what is legal, and what continues to It was the case that in the run up to and aftermath of the Global Financial Crisis in 2008 Barclays was one of the better contenders in the UK banking sector, with some smart M&A moves and canny action by the now rather controversial Bob Diamond. At least in this aspect the bank was seen to be by some as the best of a bad bunch. This was particularly the case as compared to RBS (RBS), and Lloyds Banking (LLOY), given the way the latter was hamstrung by the shotgun marriage between it and HBOS. But the reason for the coverage of the company today as a Chart of the Day is related to the technical issue of a break through the 200 day moving average at 172.75p. This should be enough to unleash decent follow on momentum, especially in the wake of a good weekly close above the 200 day line today. Indeed, the best case scenario at this point would assume that while there is no end of day close back below the June price channel floor / 20 day moving average at 166p we could be treated to a 1-2 months time frame target as high as 220p at the June resistance line projection.
Comments (0)