Chart of the Day: Admiral Group

From my perspective, cars are money losing machines, magnets to a whole array of legal infringements, and a great source of pollution and ill health to boot. Yet the car culture rolls on, and people appear blind to the costs. This is great for the likes of motor insurer Admiral Group.
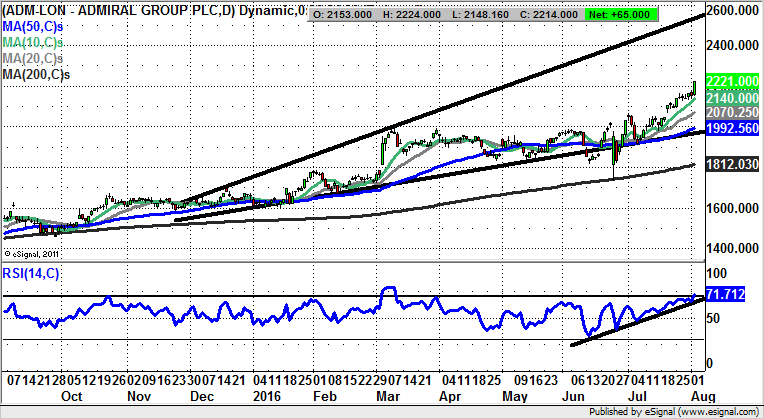
Admiral Group (ADM): Broadening Triangle Targets 2,500p
Admiral Group has been one of the most consistent performers among leading stocks. This point is underlined by the progress along the 200 day moving average from July last year from the 1,400p zone, with the 50 day moving average kicking in almost continuously since the beginning of October. All of this goes to suggest we are looking at a very robust picture, a point underlined by how it is possible to draw a broadening triangle in place since the beginning of December. This formation has its floor towards the area of the 50 day moving average, now at 1,992p, with the message being that at least while this zone holds we can regard shares of Admiral Group as being very much in ultra bull mode. Indeed, the view currently is that at least while there is no break back below the 10 day moving average at 2,140p, we should be treated to an acceleration to the upside. The favoured destination is 2,500p at the top of the end of 2015 triangle, as soon as the end of next month.

Comments (0)