Central Rand Gold to shine on the back of falling wedge reversal

FTSE 350 Stocks
Barclays (BARC): 200 Day Line Resistance
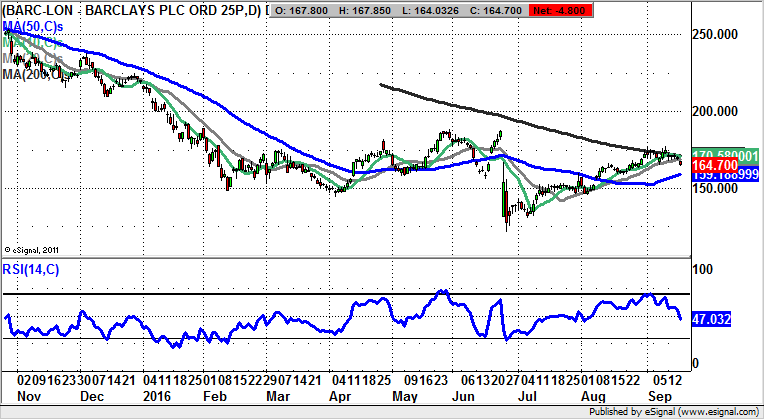
Perhaps one of the most interesting aspects of the post-Brexit rally was the way that the banking sector received a decent boost in share price terms. However, so far this month it would appear that investors are starting to think again, especially in the wake of the $14bn fine proposed by the U.S. Department of “Justice”. The position on the daily chart of Barclays is that we have been witnessing a slow ricochet off the 200 day moving average, now at 171p. Indeed, so far we have suffered a double-top reversal just through this feature. The conclusion to draw now is that while there is no end of day close back above the 200 day line, we risk seeing a test for support at the floor of last month’s gap to the upside at 152p over the next couple of weeks. But at least while the gap is held it may be too premature to right off the recovery prospects of this situation.
ITV (ITV): Extended Top Decline
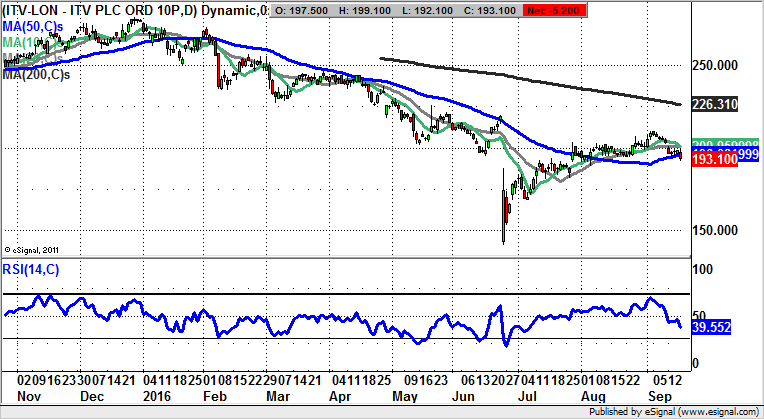
It has to be said that the charting position at broadcaster ITV is a good example of an oil tanker turn around, as the shares changed from being a prime bull M&A situation, to one where it was the bidder going for a rather expensive target in the form of Peppa Pig owner, Entertainment One (ETO). From a technical perspective one can see the disappointment written on the daily chart, coming in the form of multiple tops towards 280p last year, and the loss of the key 200 day moving average, then towards 260p in February. It is now trading at 226p, with the message being that at least while there is no weekly close above the 200 day line we can regard this situation as being a sell into strength within a firmly entrenched bear trend. The favoured scenario at this point is to suggest that while the September gap top at 202p caps the share price the downside here could be towards the floor of the June gap higher at 166p. The timeframe on such a move could be as soon as the end of next month.
Standard Chartered (STAN): Lower September Resistance
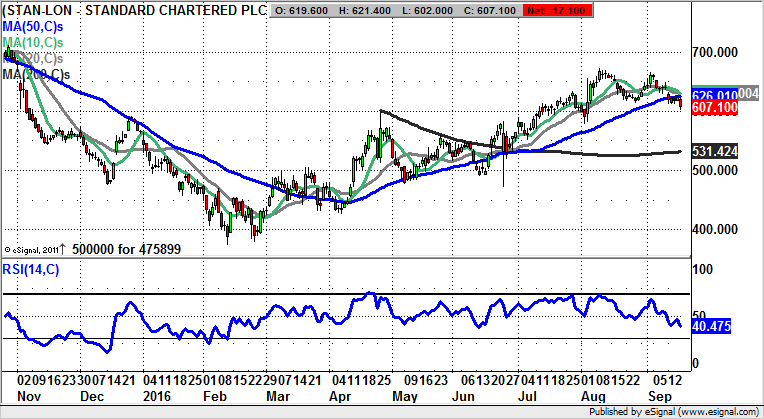
It can be seen from the daily chart of Standard Chartered that the giveaway in terms of the near-term charting setup was certainly the lower high for September to date versus the 572p August peak. This bearishness has been underlined for the end of last week by the way the latest unfilled gap to the downside takes the shares down below the 50 day moving average at 626p. This looks to be a bearish rising wedge formation as well, something which suggests that while there is no end of day close back above the 50 day line we risk seeing a decline towards the August intraday floor at 578p. This could be hit as soon as the next couple of weeks, but it may be wise not get too bearish on this situation while last month’s support remains intact.
Tui (TUI): Inverted Head & Shoulders Base
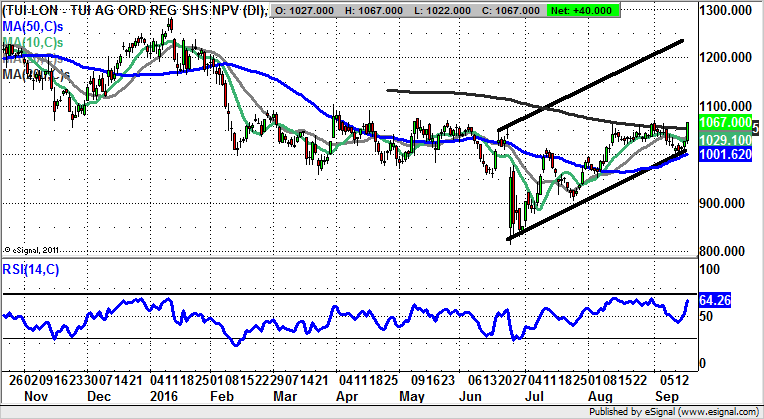
What it interesting about the recent charting history of Tui is that despite all the near-term choppiness/volatility, an inverted head & shoulders pattern is discernible in the post-April period. Neckline resistance nominally comes in at the initial September peak of 1,071p, which implies we are on the verge of a decent breakout. Also helping out last week was the clearance of the 200 day moving average at 1,054p, an event all the more powerful given the way this feature is still falling. The view at this stage is that above 1,071p should at least take Tui shares up towards the top of a June rising trend channel at 1,280p over the next 1-2 months.
Small Caps
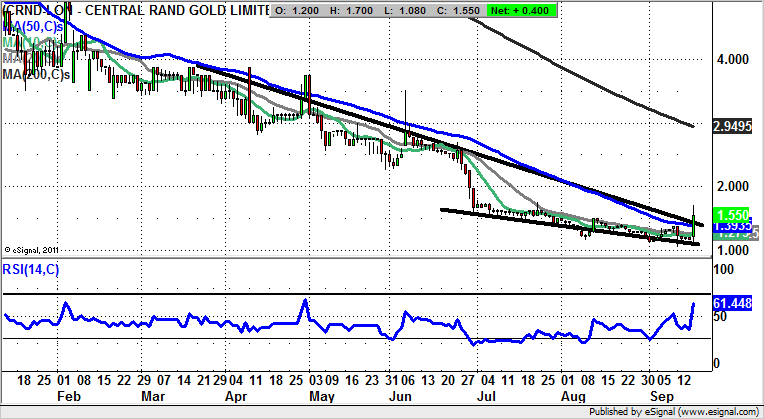
Central Rand Gold (CRND): Falling Wedge Reversal Targets 3p Zone
Given the mind blowing turnaround we have seen for the mining sector in general and Gold stocks in particular, the declines for Central Rand Gold over 2016 has been very disappointing. But it would appear the stock is finally ready to step out into the sun with the break of a bullish falling wedge pattern and the 50 day moving average at 1.39p. At least while above the 50 day line one would call the shares as high as the area of the 200 day moving average at 2.94p, equal with the former June resistance zone.
DJI Holdings (DJI): 180p Technical Target
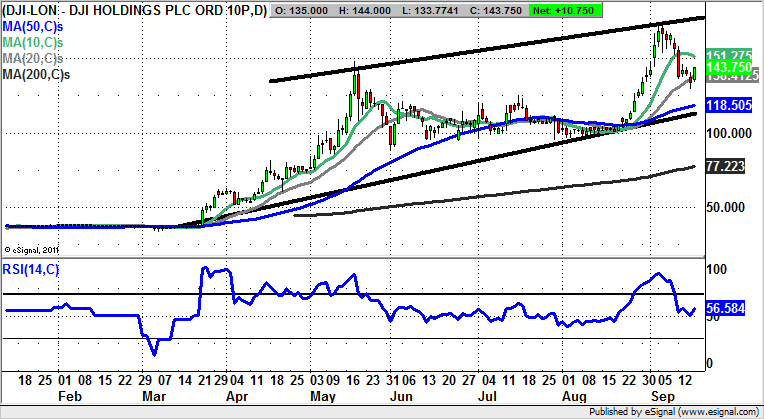
DJI Holdings represents a textbook example of a bullish chart situation, with the story underpinned by the vertical push through the 200 day moving average, followed by the golden cross buy signal between the 50 day and 200 day moving averages in April. Since then the 50 day line, now at 118p, has largely provided support on dips, with overall progress within a rising trend channel in place since March. The chances are going forward that while there is no end of day close back below the 20 day moving average at 138p we should be treated to a top of 2016 price channel target as high as 180p over the next 1-2 months.
EnQuest (ENQ): Below 50 Day Line Risks 20p
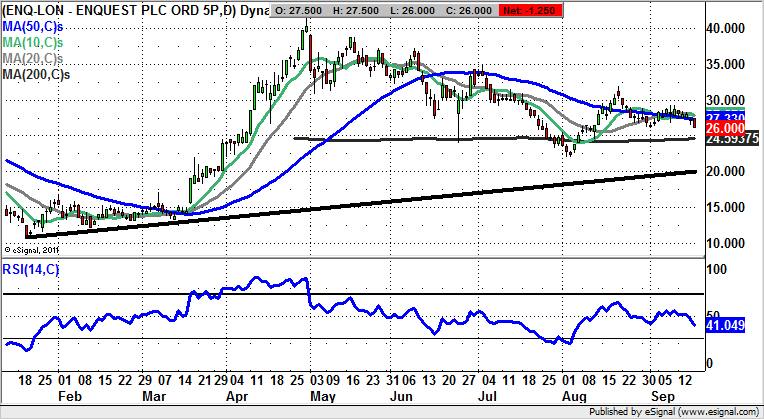
It really was a stunning recovery for Enquest shares in March of this year with the gap through the 50 day moving average, then under 15p, taking the share up to 40p plus by the end of April. Since then there has been a cooling off of the price action, a point underlined by the way the 50 day line now at 27.33p has just been lost. Indeed, this suggests there is the risk of a further correction back to the main 2016 support line at 20p, something which may be seen by the end of October. After that we can perhaps decide whether the bulls then have a fresh opportunity. Only a quick recovery of the 50 day line would suggest that this situation has already completed its corrective phase.
Comments (0)