Brightest Blue Chips

One of the “pleasant” problems of the moment is that with the FTSE 100 seemingly heading to new higher ranges, we are faced with the tough decision of attempting to work out which of the blue chips to buy into to get exposure to this move? At this same time one does not want to be left high and dry if there is a retracement. Therefore we are effectively momentum traders currently, even though I suspect that some traders may wish to keep their powder dry until after the General Election on 7th May. It will of course be interesting to see whether on this occasion being cautious actually pays off.
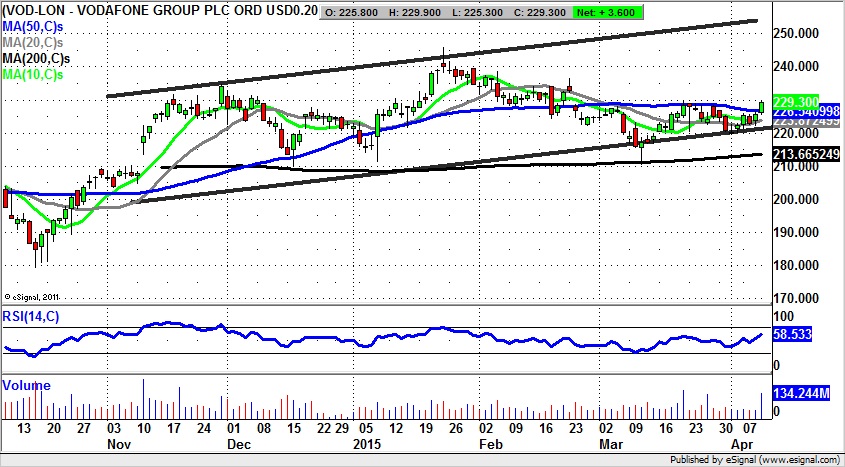
I am starting off with an old favourite of mine on both a technical and (via the dividend payout) fundamental basis – Vodafone (VOD). “Old” in this case on a technical basis refers to the period since the November unfilled gap to the upside through the 200 day moving average now at 213p. Since then we have seen no less than three attempts to fill the gap, something which suggests that the bears have had their chance to win at Vodafone, and have finally given up. This leaves us with what should hopefully be a decent positive phase for the price action as we look to progress within a rising trend channel from the autumn. The position now is that there has been a weekly close back above the 50 day moving average now at 226p, with the implication being that while there is no end of day close back below the November price channel floor at 223p, we shall be treated to a journey towards the 2014 resistance line projection at 255p, as soon as the next 1-2 months.
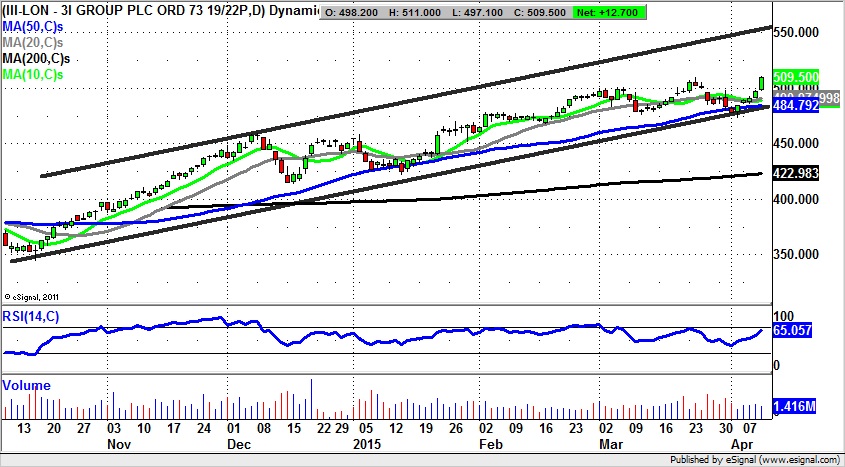
A rather more obscure blue chip comes in the form of 3i Group (III), where the investment group currently sees its shares breaking to new highs. All of this is happening within a rising trend channel from October. Last week’s action finished with a close above the former March gap at 498p, thus providing a clear charting buy signal, with the expectation being that at least while there is no end of day close back below this feature we could see progress to the top of last year’s price channel at 555p. The timeframe on such a move is regarded as being the next 4-6 weeks, with only sustained price action back below the 20 day moving average at 490p really delaying the bull scenario.
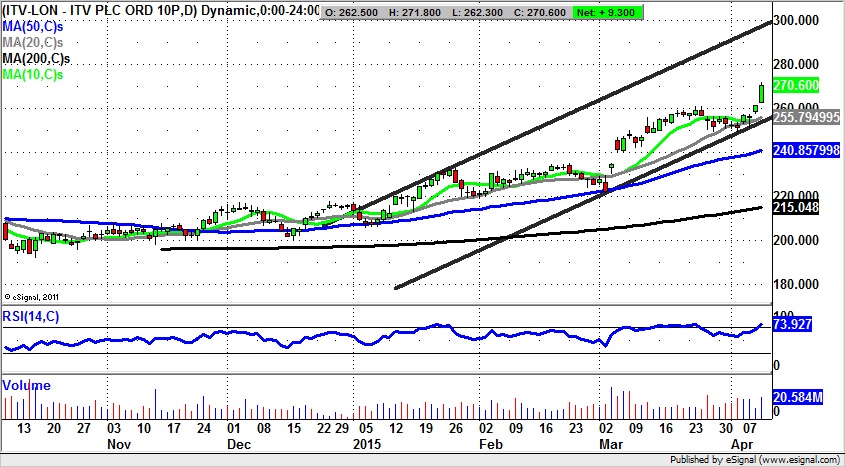
It may appear to some that shares of ITV (ITV) have already shot their bolt as far as the best of the recent rally. However, it could very well be that this week’s double unfilled gaps to the upside are highlighting to us that there is still gas in the tank as far as further upside is concerned. After all, a similar double gap manoeuvre in March led to substantial gains. The best way of playing this situation now is to assume further gains over the next two to four weeks, all of which would happen within a rising January price channel. This has its resistance line projection running as high as 300p, a target which is expected to be hit over the next 2- 4 weeks. The stop loss on the breakout argument is regarded as being an end of day close back below the floor of the second of last week’s gaps at 257p. Indeed, at this stage with the RSI at overbought 73, only cautious traders would wait on any dips back towards the floor of the second gap at 261p before taking the plunge on the upside.
Comments (0)