Aggressive Trades – Low-Risk Trade Management (Part 5)
")
For the last several posts I’ve been talking about entering and managing trades. I looked back at what we could have traded on a fairly random stock from the LSE, Daejan Holdings plc (DJAN). I looked at how we could have traded it aggressively but with a tight control on risk over the last few years. I shall now look at the opportunities it presents currently.
Let’s assume we’re not in the stock as this will most likely be the case for all of us. This is a typical LSE stock at the moment. It has done very well over the last few years and is now showing signs of weakness. We have to look at all possible trades, as we probably have done for the last few years, in the light of the current bull market being over seven years in. This is unusual and a major correction could be due at any time. That said, it’s eluded us for a few years now, but we can’t ignore it.
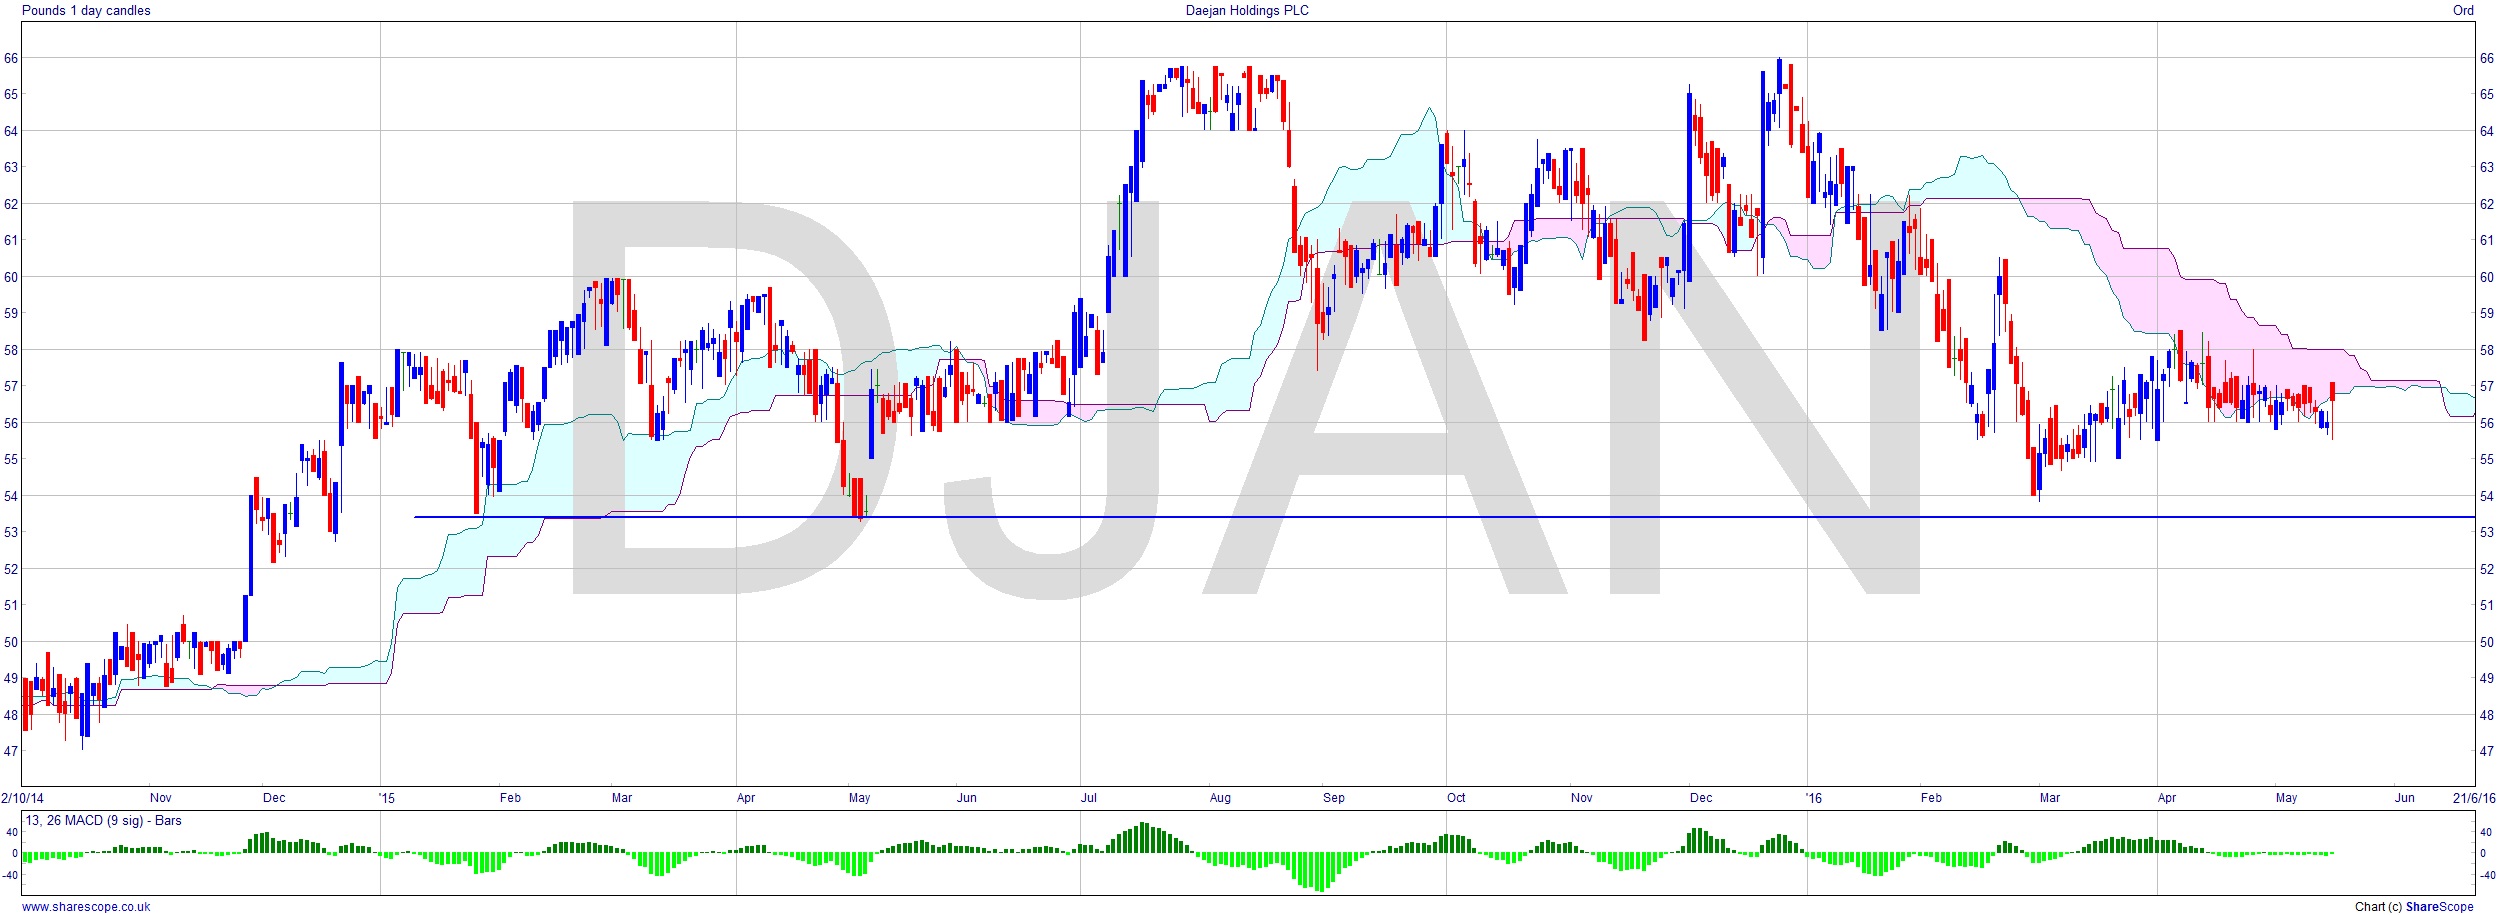
We could look at this whole daily section of the chart, from Q4 2013 to the present, as a massive double-head Head + Shoulders – which is a sound analysis and augurs well for a lot of downside. Normally I’m not a big fan of the double top. It’s often almost nebulous and people put too much stock in it (see what I did there?). However, we have a H+S set up against the backdrop of an overdue correction. I’ll have some of that.
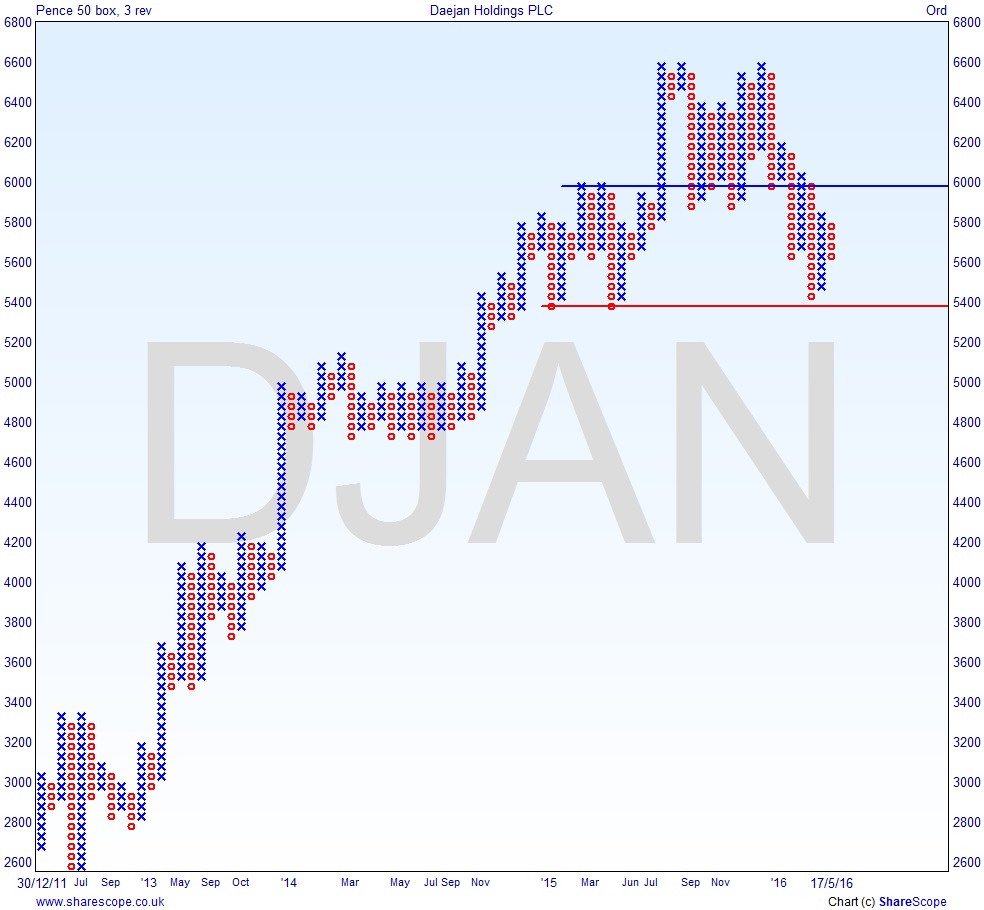
A quick look at the P+F chart shows that the recent decline hasn’t challenged the resistance level, which would be the left shoulder of the H+S at just below 6,000. That said it’s yet to challenge support at around 5,400, but the trend is clearly down. P+F charts, for those who aren’t familiar with them, are essentially a more readable form of swing chart.
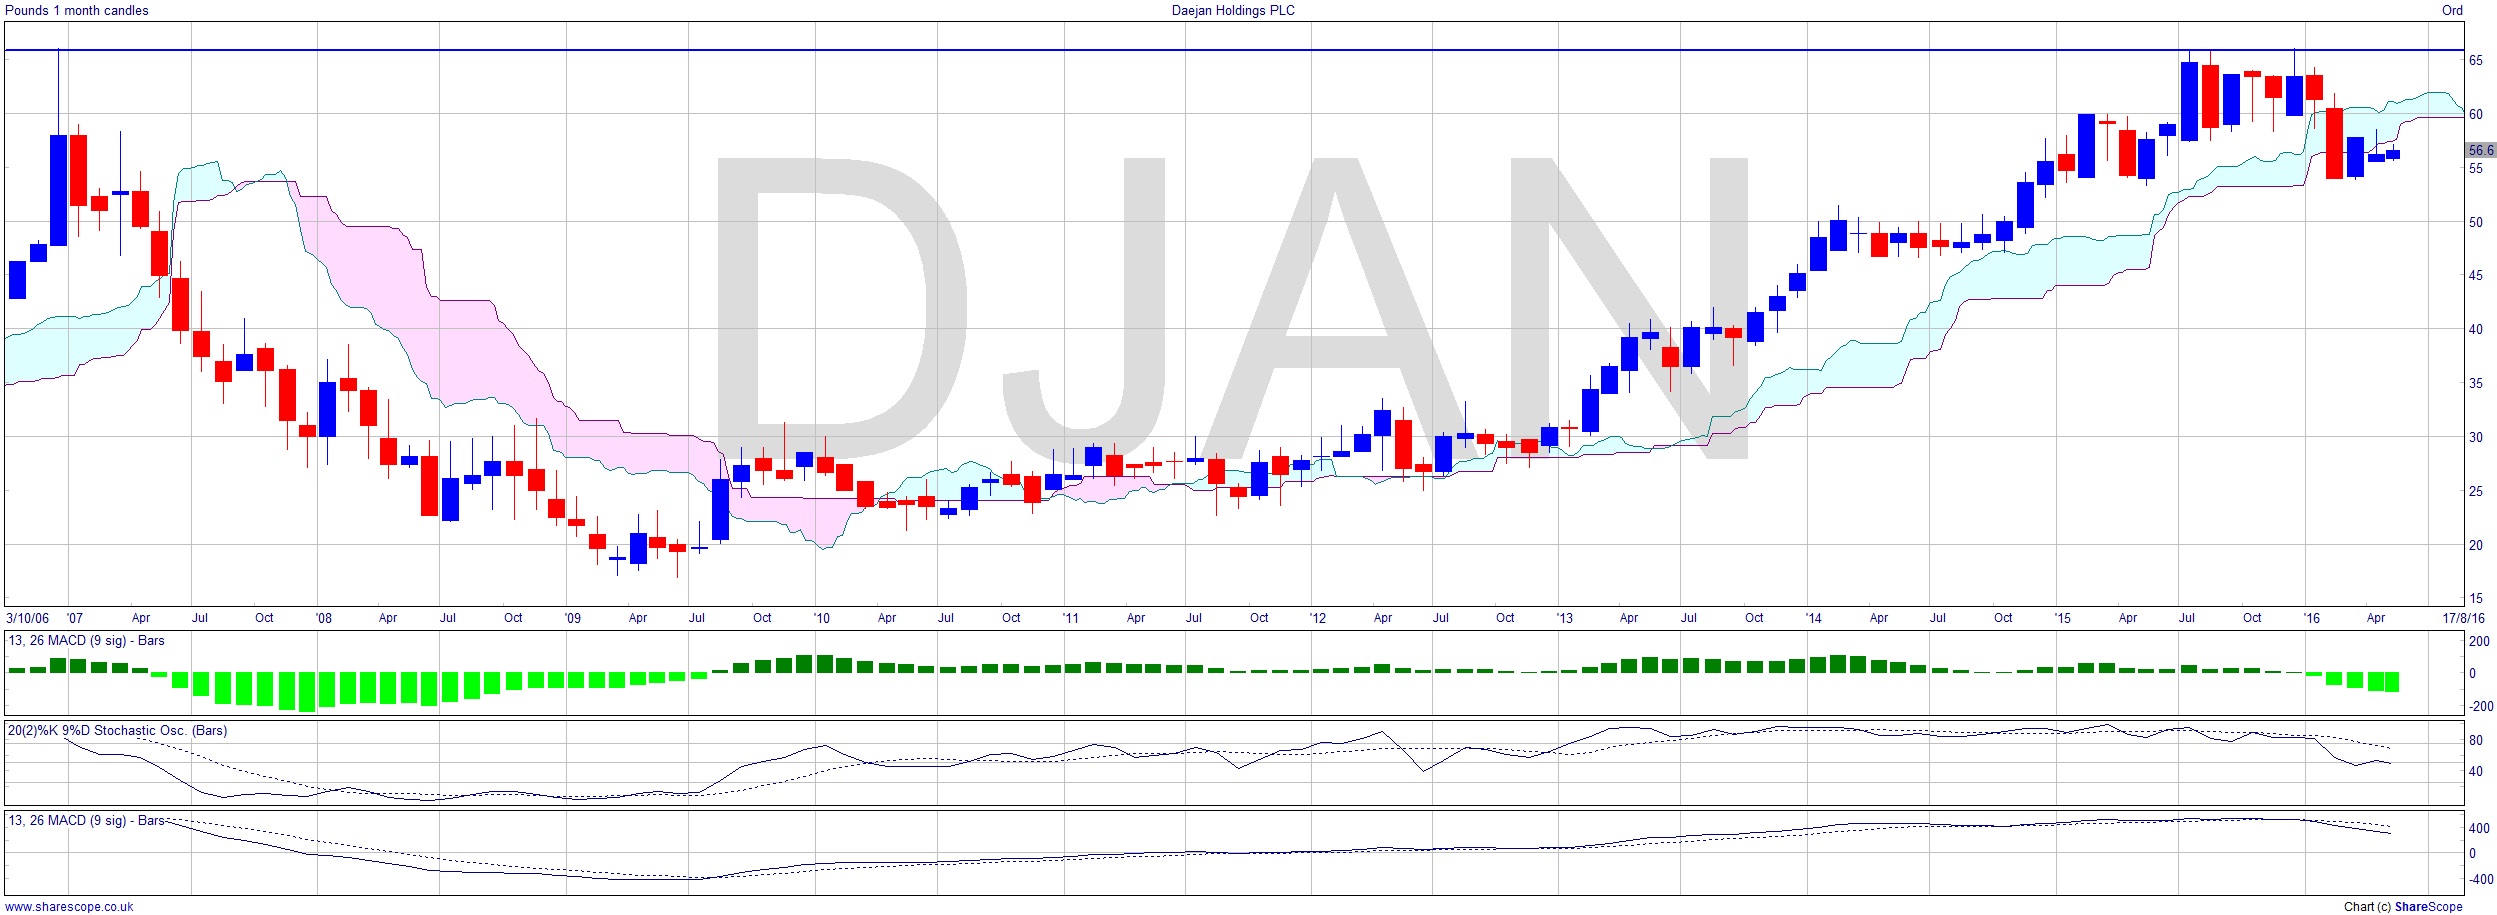
I’ve also shown the monthly chart going back to ’06. It uses the weekly Ichimoku cloud as the monthly one is pretty useless unless you expect to live and trade for a few hundred years. MACD signal lines are bearish (that’s the very bottom plot). We have fallen below the cloud now, but the interesting thing here is that I’ve marked on the ATH at about £66. Look way back to the end of ’06 and you’ll see it was already the ATH. This is significant for two reasons. Firstly, it failed to break the high of 10 years ago. Secondly, as this is not a FTSE 100 high volume stock, there is a possibility that someone, or some organisation, could have an interest in selling at that price based on their existing holdings. In a stock like BT or Vodafone I’d say a ten-year-old price level is irrelevant, as it wouldn’t have enough impact on the stock to leave any long lasting mark if they sold. But here we might have a company director with a significant interest, or a pension fund. The stock is capitalised at just shy of £1bn. So it’s not huge. A quick Google search (yes, it really is that easy) reveals that, as of early May 2016, 8.33% of the shares were held by the top 10 institutional investors. They’re unlikely to sell out at the all-time high, so probably the old ATH level is an academic one.
So, my entry? I’d gladly take a half position short at around £56 if and when the price falls from there and has failed at the cloud – probably what we see playing out right now. If the price goes up into or especially above the cloud, then I’d have to rethink. Initial decision point around £54, stop: notional at the cloud, declared around £58. Isn’t that an awful risk/reward? No because my stake is a half so any losses would be half, but a successful trade means I’ve gained early entry. Also the hard stop is superseded by the notional stop, which I don’t divulge to the market, during market hours, but would probably put at around £57. Risk reward, intact you see. And now we wait…
Comments (0)