Zak’s Weekend Charts Round-Up

FTSE 350 Stocks
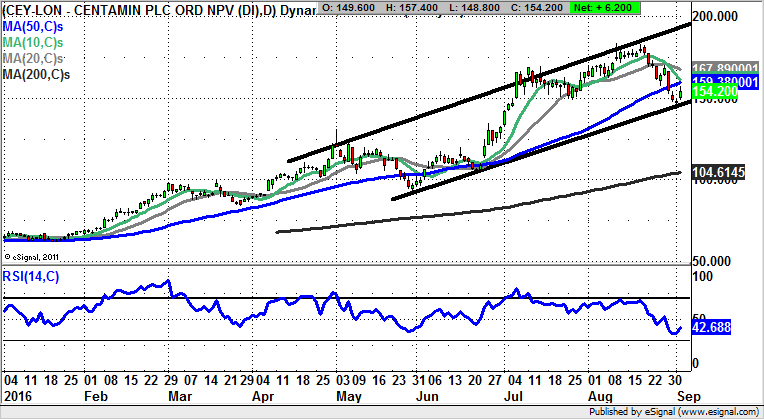
Centamin (CEY): Above 50 Day Line Could Lead Back Towards 200p
While Centamin has been a decent play on the upside as far as being a proxy to the Gold price, the reality of any proxy is that the volatility can mean that even if you are right, in the short term you can be offside. This point is underlined by the way we are trading in the aftermath of a double top for the stock above 180p, with a low print since then back at 143p. This coincides with the floor of a rising trend channel which has been in place since the end of April. The hope now is that there will be no break back below the floor of the channel ahead of a new leg to the upside to retest the best levels of the year to date. The ideal scenario is that there will be a move to the top of the April channel as high as 200p by the end of October. The best buy entry trigger would be an end of day close back above the 50 day moving average, now at 159p.
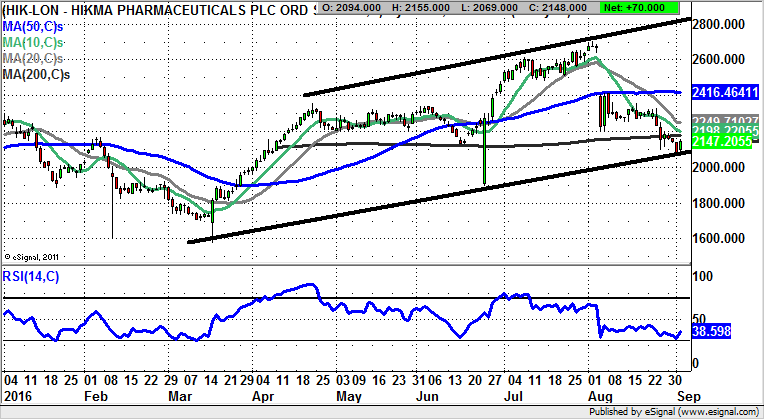
Hikma Pharma (HIK): March Support Line Rebound
Just as we can see how shares of Centamin have bounced off an extended uptrend line on their daily chart, for Hikma it is evident that there has been an almost exact deflection off the floor of a rising trend channel which can be drawn in from as long ago as March. What is positive currently is that the reaction from the trendline has been so clear, and this allows us to tentatively call time on the post-August meltdown for the shares. The only missing ingredient at the moment is really an end of day close back above the 200 day moving average, now running at 2,096p. That said, the sharp break back above last month’s 2,096p should be enough of a cue to go long for aggressive traders. This opens up the prospect of a retest of the 50 day moving average and August gap floor near 2,150p, something which could be seen over the next 2-4 weeks.
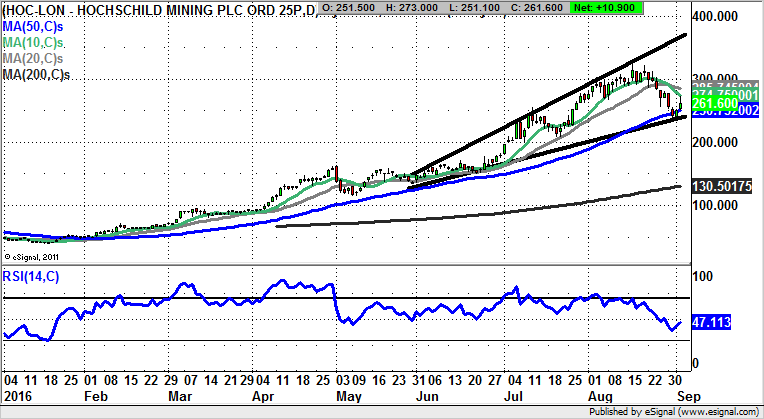
Hochschild Mining (HOC): Broadening Triangle Targets as High as 380p
The rise and rise of Hochschild Mining so far this year has been as powerful as it has been impressive. The latest phase of the climb started at the beginning of June, which is where the present broadening triangle has its support line running just below the 50 day moving average at 250p. The likelihood now is that provided there is no end of day close back below the 50 day line we should be treated to a new, significant leg to the upside. The favoured destination at this point is regarded as being the June resistance line projection at 380p – on a 1-2 months time frame. A clearance of the 10 day moving average, at 274p currently, would be a decent momentum buy trigger for cautious bulls.
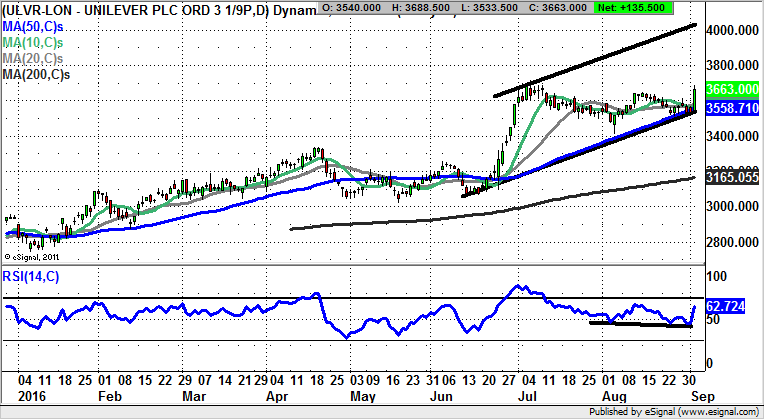
Unilever (ULVR): 4,000p Price Channel Target
Shares of Unilever proved that the stock market cliché of elephants not being able to gallop is wrong, especially in the wake of the Brexit vote at the end of June – which caused Dollar earners of all shapes and sizes to rally sharply. The present position is that we have seen a rebound off the floor of a rising trend channel which can be drawn in from as long ago as the middle of June. What is tantalising at the moment is that the top of the trend channel is pointing as high as the 4,000p level, a zone which could be hit as soon as the end of next month. At this stage only an end of day close back below the 50 day moving average at 3,558p would even begin to delay the upside scenario.
Small Caps
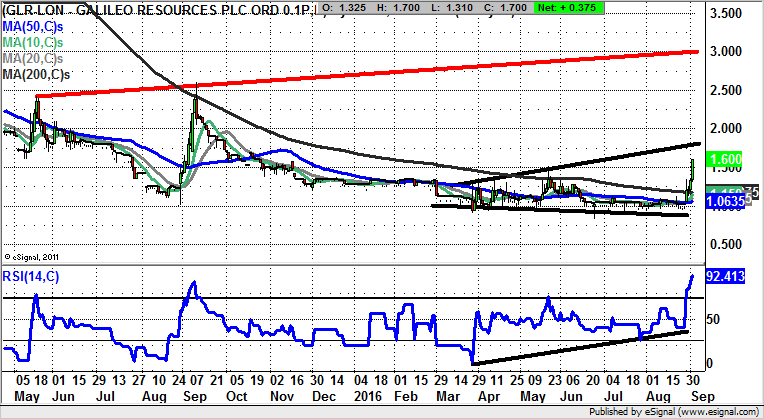
Galileo Resources (GLR): 1.80p Initial Target, then 3p in Focus
It is usually the case that stocks and markets which gap higher through their 50 day and 200 day moving averages go on to do well, and this has been the case with Galileo Resources since the gap through the 50 day line last month at 1.06p currently. What is interesting now is the way that the initial 1.8p March resistance line projection at 1.8p is fast approaching. The hope now is that as little as a weekly close back above this feature could take Galileo Resources up towards a rather more ambitious target. The favoured 2-3 months target in this respect is derived from a resistance line projection from May last year, currently heading as high as 3p.
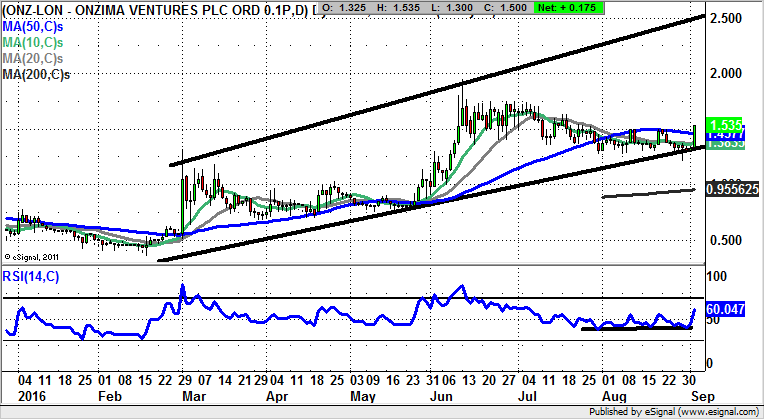
Onzima Ventures (ONZ): Break of 50 Day Line Brings 2.5p Back in Focus
Although Onzima Ventures shares have been rather more of a slow burn than a gallop in terms of the move to the upside in recent months, it can be seen how it is possible to draw a rising trend channel from the beginning of March. The floor of the channel currently runs level with the 1.30p level, well above the key 200 day moving average at 0.95p, a very positive sign in its own right. We can combine this construction with the way that August witnessed a quadruple bounce for the RSI trace at the 40 level, which can be regarded as a leading indicator on a new leg to the upside. The lagging indicator is in fact the latest break above the 50 day moving average, now at 1.43p. After an extended consolidation phase it is now to be hoped the long awaited 2.5p target at the top of the rising trend channel from earlier this year could be seen for October / November.
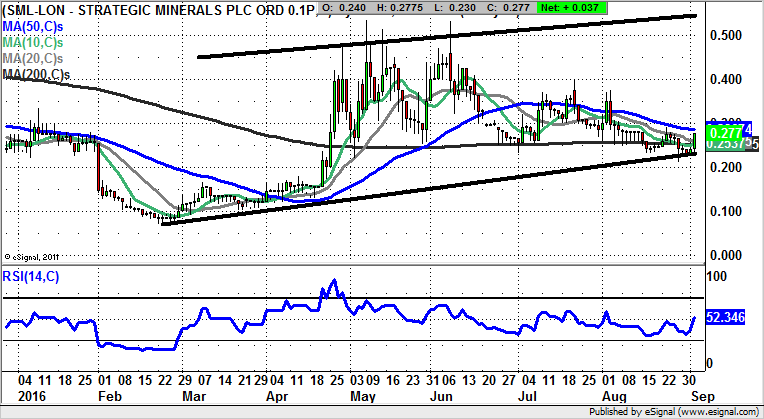
Strategic Minerals (SML): 0.5p Range Highs
For fans of Strategic Minerals it really has been a long wait for the glory of seeing the stock back towards the best levels of the year above 0.5p. However, in the wake of the latest post-August double bear trap rebound from below the 200 day moving average at 0.25p, we may finally be seeing the stock deliver at least an intermediate rebound. This is hopefully on tap with as little as an end of day close back above the 50 day moving average, currently running at 0.29p. But it should be remembered this has been a very frustrating situation.
Comments (0)