Zak’s Weekend Chart Round-Up

FTSE 350
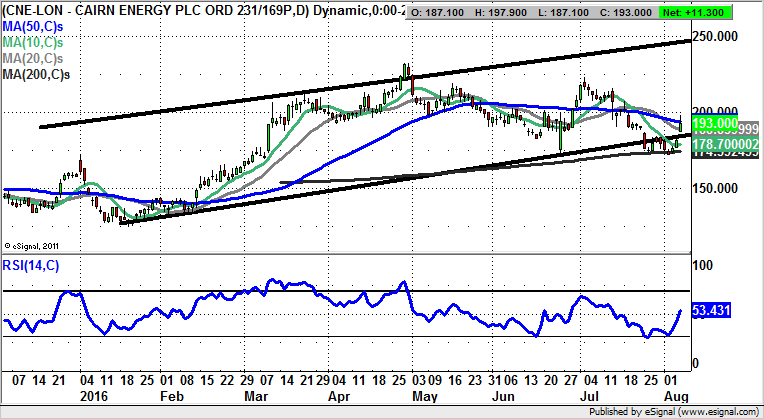
Cairn Energy (LON: CNE): Gap Towards 220p Plus
What is evident on the daily chart of Cairn Energy is the way the run up to the main 2016 rally was flagged early in the year. January served up a vertical push through the 50 day moving average then towards 140p, with March delivering a golden cross buy signal between the 50 day and 200 day lines. This week ended on a flourish, coming in the form of a gap towards the 50 day line at 194p. As little as an end of day close back above this feature early next week should be enough to take the shares onto the former post April resistance at 220p plus as soon as the end of this month.
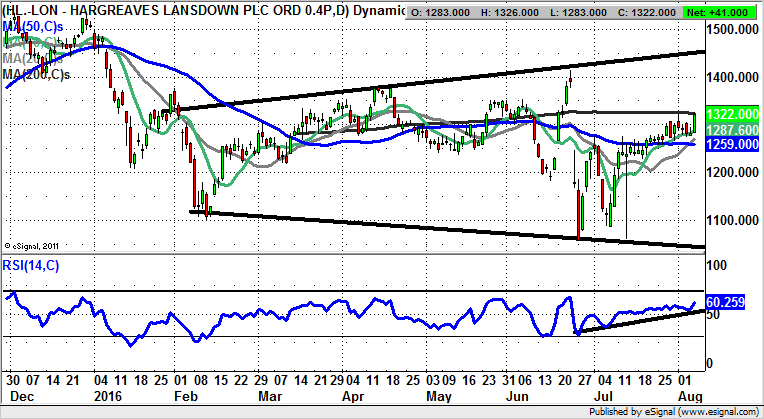
Hargreaves Lansdown (LON: HL.): Triangle Target at 1,450p
June and July may have been a horribly volatile period for shares of Hargreaves Lansdown, and the stock market as a whole, but it would now appear we have settled down for a decent run to the upside. This is said in the wake of the late July break above the 10 day moving average at 1,287p which has so far in August come in as new support. An end of day close back above the 200 day moving average at 1,323p next week can be regarded as the momentum buy trigger to take the stock towards the top of a broadening triangle in place on the daily chart since February, with its resistance line projection heading as high as 1,450p. The timeframe on such a move is regarded as being over the next month.
Hikma Pharma (LON: HIK): Price Channel Support At 2,200p
It has been a fascinating week for watchers and traders of the price action at Hikma Pharma. A warning from the group left the stock reeling with an unfilled gap to the downside through the 50 day moving average, normally a very robust sell signal. However, it would appear traders are so far giving the company the benefit of the doubt in the sense that there has been a positive reaction at the floor of a rising February trend channel, one which has its floor at the 2,200p level. Therefore, it may be the case that some traders take the view that while there is no end of day close back below this feature, Hikma may be regarded as a bottom fishing situation. Only cautious traders should wait on a break back above the 50 day moving average at 2,416p before assuming a return to the best levels of the year at 2,600p plus.

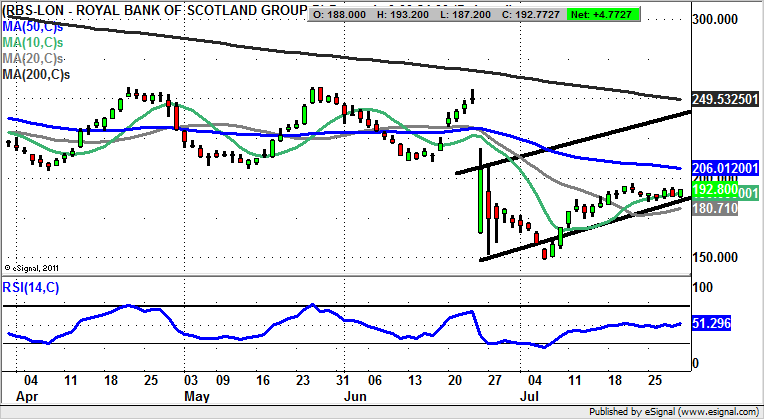
RBS (LON: RBS): Triangle Breakdown Risks 150p Zone
It has to be wondered how, after not turning in a profit for 9 years, and instead losing money hand over fist, why the taxpayer-owned Royal Bank of Scotland is simply not closed down. The daily chart configuration underlines this sorry state of affairs, with the triangle break to the downside in the wake of this week’s money loss update. The final insult has to be the £1.4bn lost in the attempt to sell off Williams & Glyn. All of this really makes the bank the laughing stock of the sector – if the vast of amount of losses was not so painful. As far as what may happen next in terms of the price action, it can be said that while there is no end of day close back above the May resistance line / 10 day moving average at 188p, the downside for the shares could be a fresh test of the post June 150p support zone over the next 4-6 weeks.
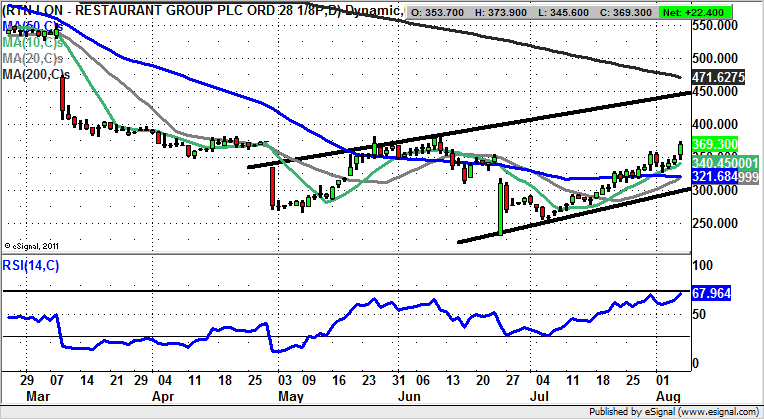
Restaurant Group (LON: RTN): April Price Channel Target at 450p
Restaurant Group has been on the radar as a stock which may have been unfairly beaten down, at least from a fundamental perspective. Helping this along could very well be the overall recovery for the stock market in recent weeks. All of this could mean that after an extended post April basing, the shares are ready to put in an extended rally. The notional target is seen as being the top of a rising trend channel at 450p with its resistance line projection at 450p over the next month.
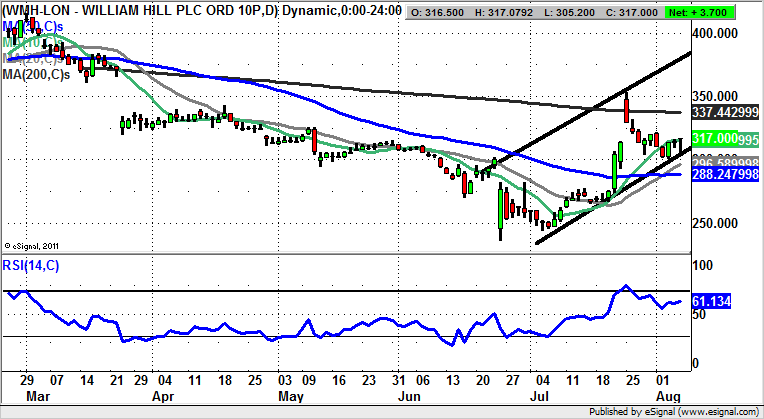
William Hill (LON: WMH): 380p Price Channel Target
It has been a busy few weeks for bookie William Hill, with possible M&A moves complicating a turbulent period for the stock market as a whole. The present position is that we have been treated to progress within a rising trend channel, one which has been in place since as long ago as the end of June. The floor of the channel is underpinned by the 20 day moving average at 286p, with the message being that while there is no end of day close back below the 20 day line, we may be on the receiving end of a top of 2016 price channel target as high as 380p. This target could be hit as soon as the end of next month.
Small Caps:
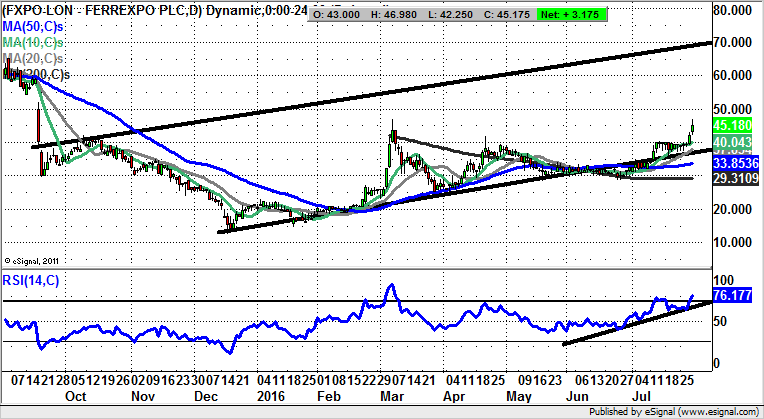
Ferrexpo (LON: FXPO): As High as 80p Near Term
One of the phenomena of the year to date has been the recovery in mining stocks, and all things related to such commodities. In the case of Ferrexpo, we can see how the shares have just delivered a bull flag breakout to end the week, all of this within a rising trend channel. This has been in place since December. The view at this stage is that even though the shares are very overbought at RSI 79, while above the former March peak at 47p, the upside could be as great as the late 2015 resistance line projection at 80p over the next 1-2 months.
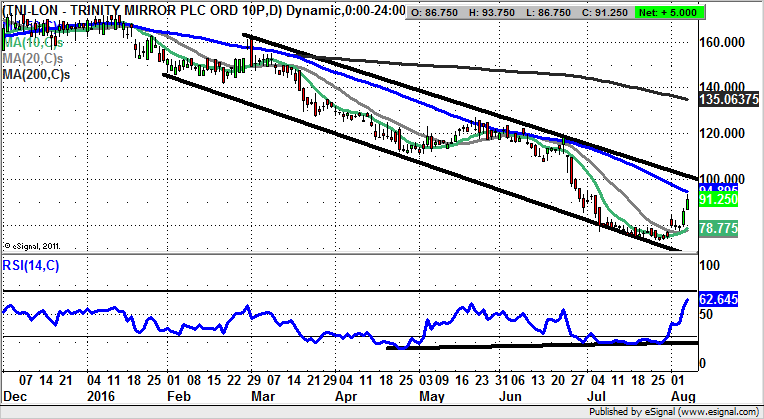
Trinity Mirror (LON: TNI): Return Towards 100p
A standout as far as the charting profile of Trinity Mirror is the possibility that for the post June period we have been treated to a U shaped reversal, one of the stronger ones in the technical analysis textbooks. All of this allows us to assume further upside here while there is no break back below the initial August peak of 85p. While this is the case, the top of the falling trend channel from February is regarded as being the “minimum” on the upside over the next 2-3 weeks.
Comments (0)