Zak’s Daily Round-Up: BDEV, IHG, JMAT, ARS and WSG

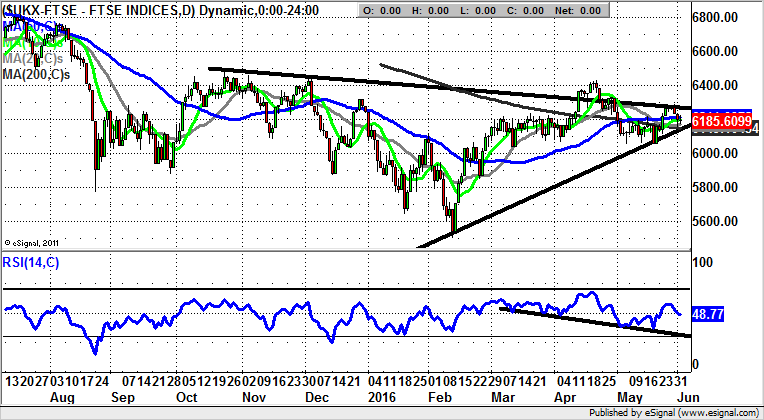
Market Direction: FTSE 100 6,150 Has to Hold
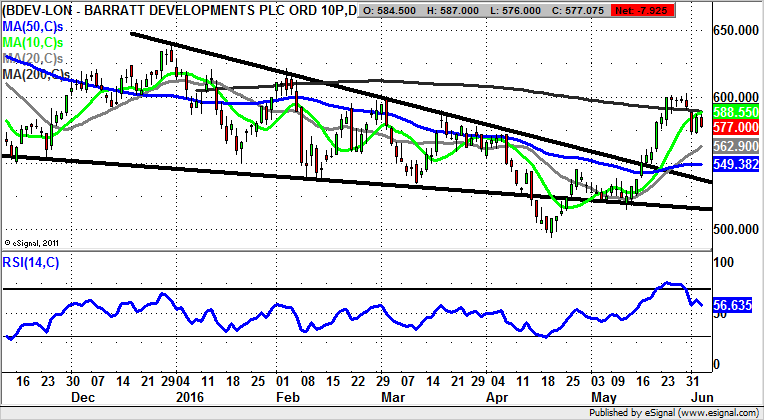
Barratt Developments (BDEV): Trading Range Break Awaited
One of the notable aspects of trading non-resources blue chip stocks ahead of the Referendum vote is that much of the volatility has died down. Indeed, even the FTSE 100 itself seems to have gone into a holding pattern between 6,150 and 6,300 currently. For Barratt Developments it can be seen how there has been a pullback from the 600p zone, with the retracement heading towards the 20 day moving average at 563p. This looks as though it is going to be the trading range for the rest of the month. However, it is still the case that one would probably regard the technical glass here to be half full rather than half empty – if only on the basis of the frightening and deliberately engineered housing crisis – and 600p will give way over the next couple of weeks.
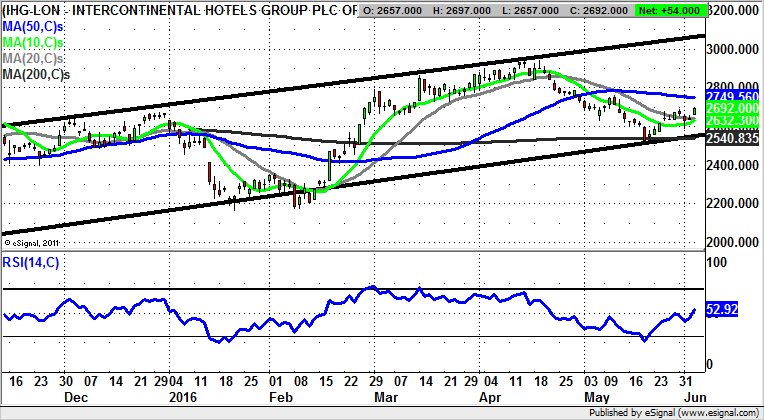
Intercontinental Hotels Group (IHG): Gap Fill Rebound
Over the years one does one’s best to avoid the egg on face calls if humanly possible. This is difficult given the way that, in general, traders gravitate to the most difficult and speculative situations which are very often a mess of both technical and fundamental factors, very often at total odds with each other. For the Intercontinental Hotels Group daily chart the start of June shows the way that there was a one day gap fill of the late May feature down to 2,618p. This offers us a decent risk/reward setup in the sense that while there is no end of day close back below the gap we can assume a reasonable near-term recovery. The favoured destination at this point is seen as being as high as the top of a rising trend channel in place from as long ago as late August last year. Only cautious traders would wait on a clearance of the 50 day moving average at 2,749p on an end of day close basis before taking the plunge on the upside, especially since the RSI, now at 51.14, has just crossed above the neutral 50 level with decent momentum. The timeframe on the upside scenario is regarded as being as soon as one month from any 50 day line clearance.
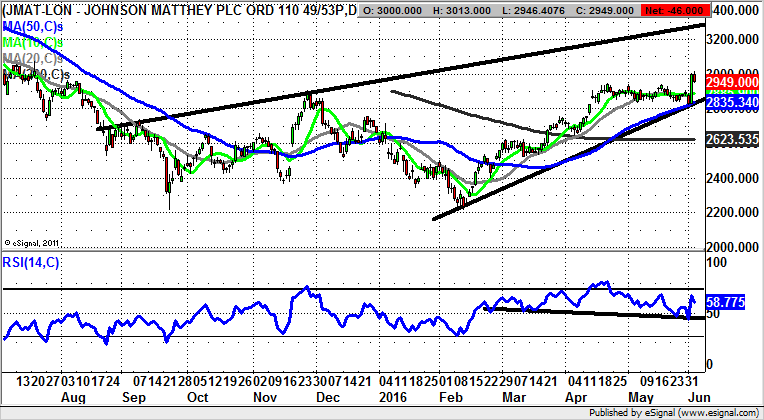
Johnson Matthey (JMAT): 3,300p on Tap above 50 Day Line
The 50 day moving average on the daily chart of Johnson Matthey has played an active part in the fortunes of the stock since the beginning of the year, and in the wake of the latest price action, looks as though it could continue to do so for quite some time. This is said after the latest sharp rebound off this key technical feature, now running at 2,836p, also the level of an uptrend line in place since January. It can be seen how that month the shares gapped up through the 50 day moving line, essentially kickstarting the latest bull run. Also noteworthy is the way that the shares have double bounced off an uptrend line in the RSI window, at the neutral 50 level. The expectation now and for the rest of June is that there will be a journey towards an August resistance line projection currently pointing at 3,300p. In the meantime any dips towards the 50 day line / former May resistance under 2,950p is regarded as a buying opportunity. Only back below 2,800p on a sustained basis really questions the bull argument.
Small Caps
Asiamet Resources (ARS): Above 50 Day Line Targets 6.5p
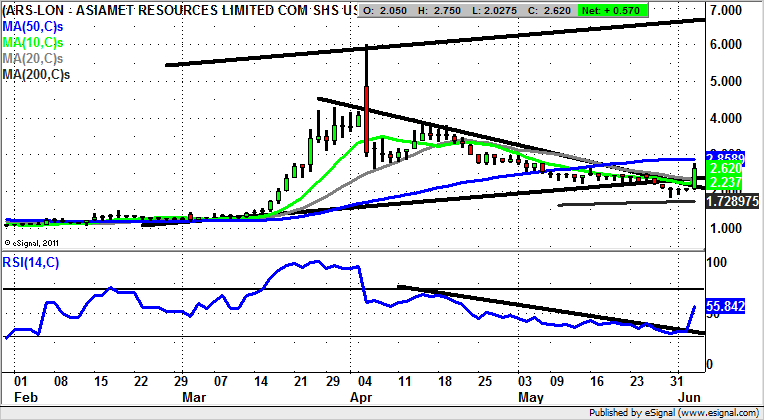
It is of course a pleasure to see Asiamet Resources make a new leg to the upside, and even more so given that to date the company has done what it said it would and within the expected timeframe. The latest spike for the stock is positive for several reasons. The first is the rebound from well above the 200 day moving average at 1.72p, and well above the former pre March resistance at 1.5p. Also noteworthy is the way we have snapped the April resistance lines in the price window and the RSI oscillator window. The view now is that provided there is no end of day close back below the 20 day moving average at 2.33p, the upside here could be as great as the 3.87p April resistance over the course of June. The big picture target is 6.5p at the top of a rising trend channel from March. At this stage only cautious traders should wait on a clearance of the 50 day moving average at 2.85p before taking the plunge on the upside. That said, given the way the RSI 50 level has been crossed so easily with the latest share price jump, one would be reasonably confident of not needing to wait on a momentum signal such as a 50 day moving average break.
Westminster Group (WSG): Bear Trap Gap Reversal
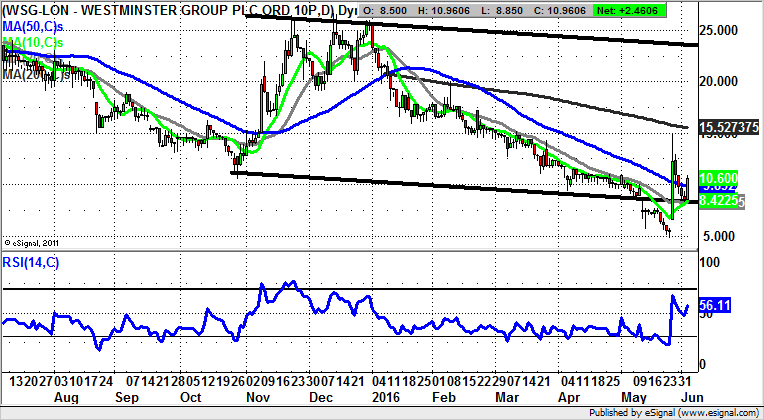
Westminster Group is a former bulletin board hero stock, which understandably fell on hard times, with the overall fall in the stock market as well as the decline in resources stocks. The present position, however, does give cause for optimism, given that we are trading in the wake of a bear trap gap reversal in place from as long ago as the latter part of last month. The big positive event this week has been the rebound off the 10 day moving average at 8.42p, and likely break back above the 50 day moving average at 8.42p. At least while the 10 day line is held on an end of day close basis one would take the view that this stock is preparing to retest the area of the 200 day moving average at 15.52p over the next 2-4 weeks. Helping build confidence is the way that to start June there has been a rebound off the neutral RSI 50 level to leave it at 56 – a relatively non volatile long entry opportunity. At this stage one would suggest that only well below the gap towards 7p would really suggest we are witnessing another false dawn situation for Westminster Group shares.
Comments (0)