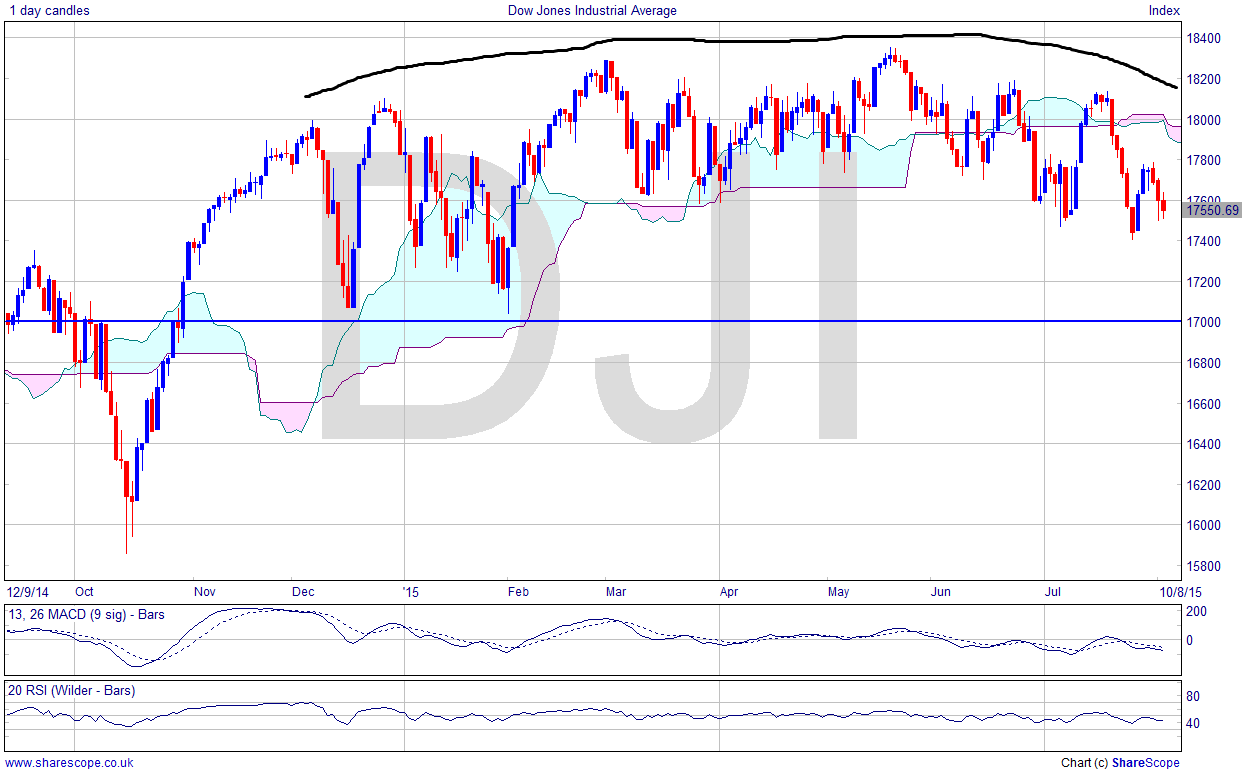
Is the Dow Jones Rolling Over?

I wrote about the US market on 7th July and the subject perhaps deserves revisiting now. The Dow Jones has developed an interesting pattern. It’s basically ‘rolling over’. I’ve marked the rolling on the chart in black. Remember it’s been six years of rising prices now, and although the US economy still appears one of the strongest in the world, the last few months have not been confidence-building for the stock market investor. A correction is not out of the question and a short bear market wouldn’t hurt: some nice quick shorts and a chance to buy in more cheaply before the next bull market. What’s not to like?
I think the key to the Dow is the 17,000 level. If we see it drop below that (there is support just above it), and the NASDAQ and S&P are not breaking new ground, then that could be the sign of a correction. The summer months though are not known for their bullishness, so that should be considered.
I’ve moved house during the last month, and as a result I haven’t had my usual sophisticated databank available through some of that time. Consequently I missed a couple of nice developments on the US stocks I talked about on the 7th July’s blog post.
Microsoft seems to want to be Google. As far as the initial responses to Windows 10 go, it seems to be an intrusive data collection service presumably with a model of selling that data to advertisers. One imagines an operating system is even better placed even than Google to collect data. This may explain why MSFT found support at the critical $44 level I talked about last time, instead of falling.
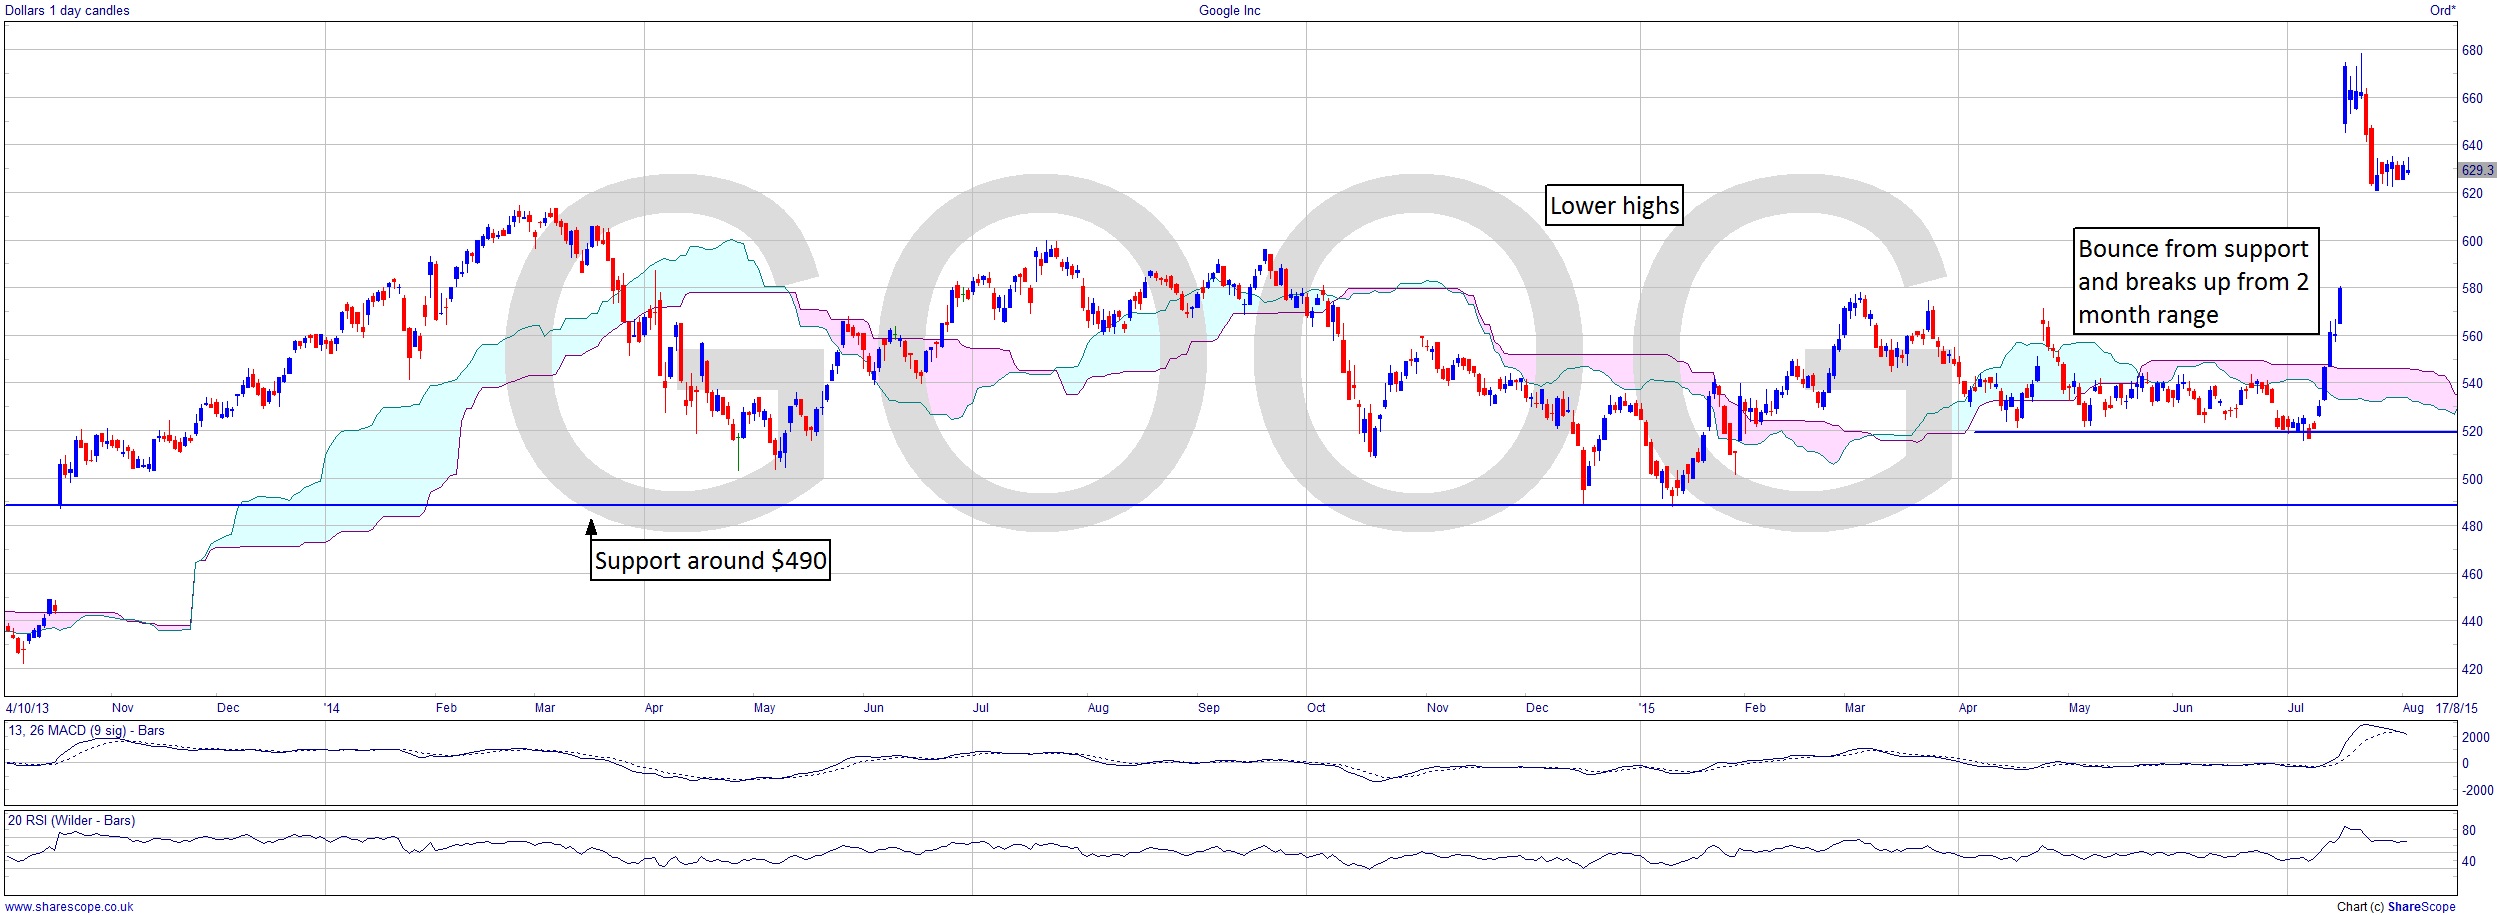
Google has gone ballistic though. A gap up and then what looks like profit taking. I missed it creeping up from the support level and announcing a move up, which would have been very lucrative for those who were watching, although now it looks a bit forlorn having retraced somewhat. If it falls a little further the question is whether or not it will find support at the $610 level of the ATH last Feb?
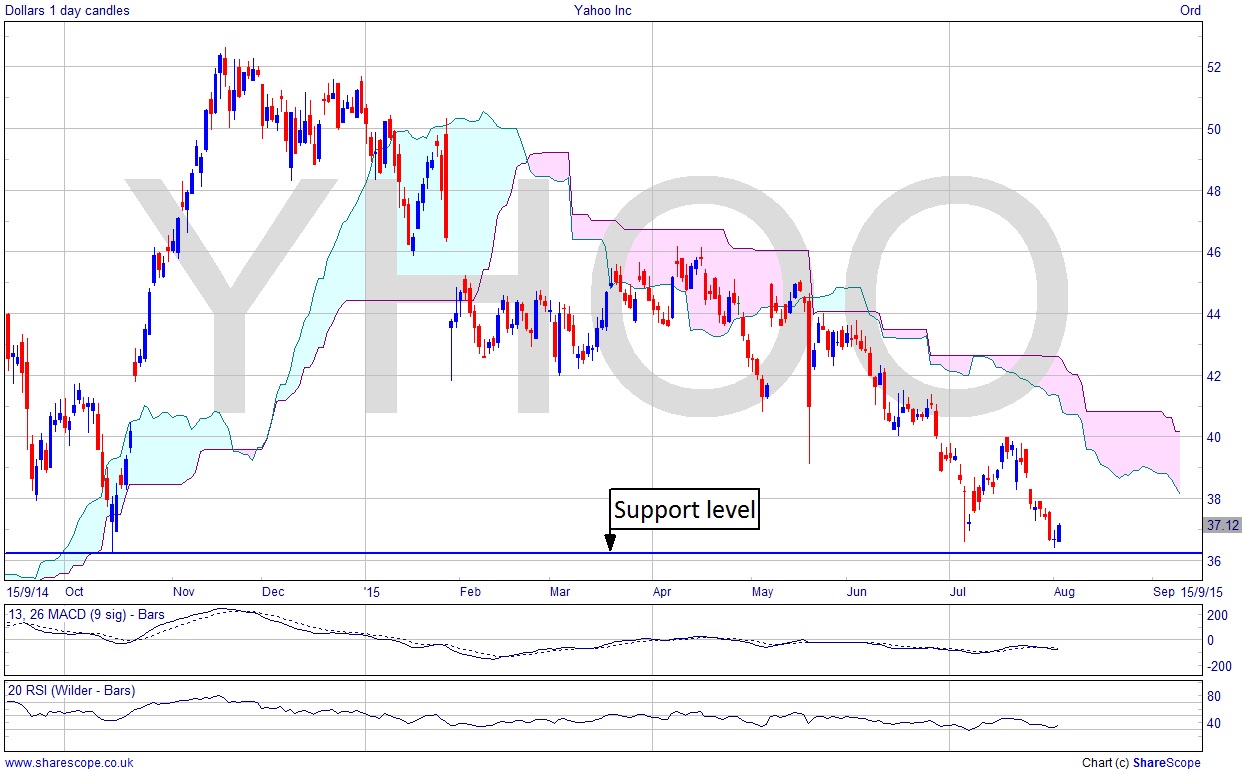
By contrast Yahoo has continued to fail as I outlined, reinforcing the downward trend with a lower high and down to around $37 now. Watch out for the $36 level. It’s an important support, so if that gets broken then it really doesn’t look that good.
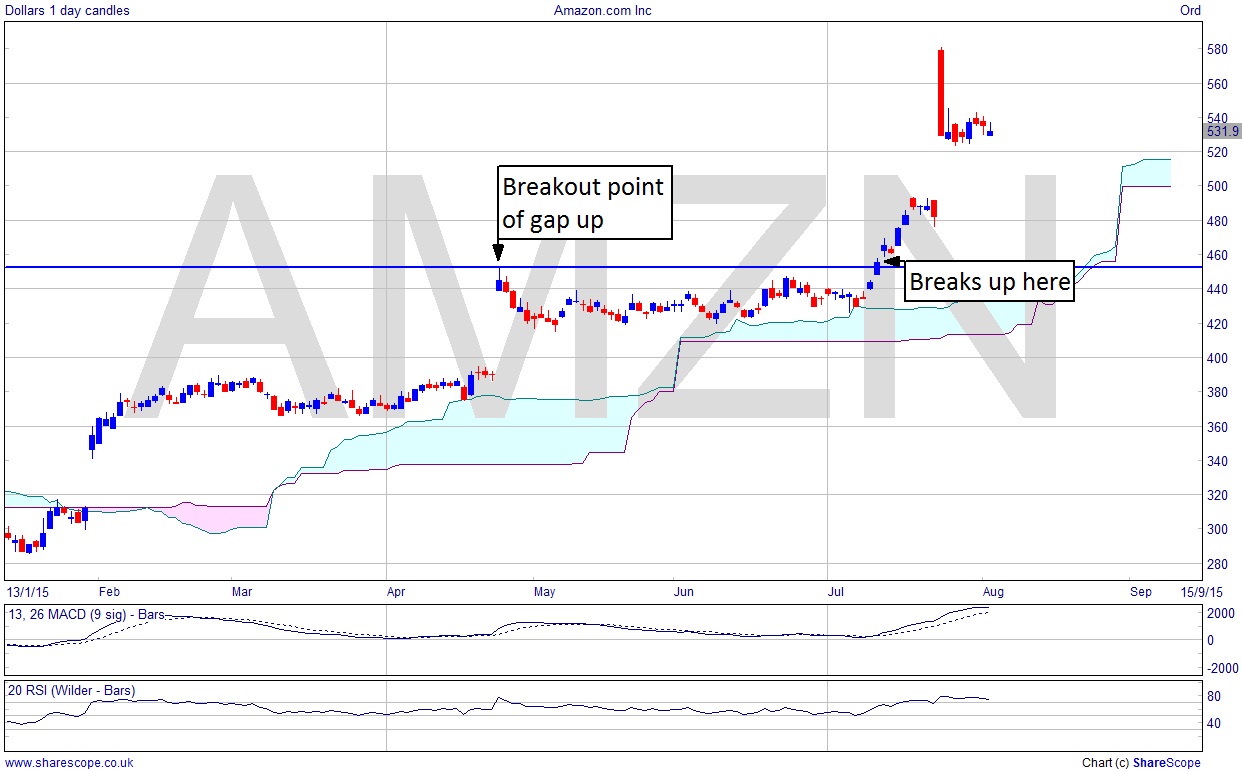
Amazon I said “looked in good condition” but I was reticent to buy without “more positive factors”. The move up above the ATH was just that and they’ve now jumped from around $440 to $530 and have been higher, up to $580 in fact.
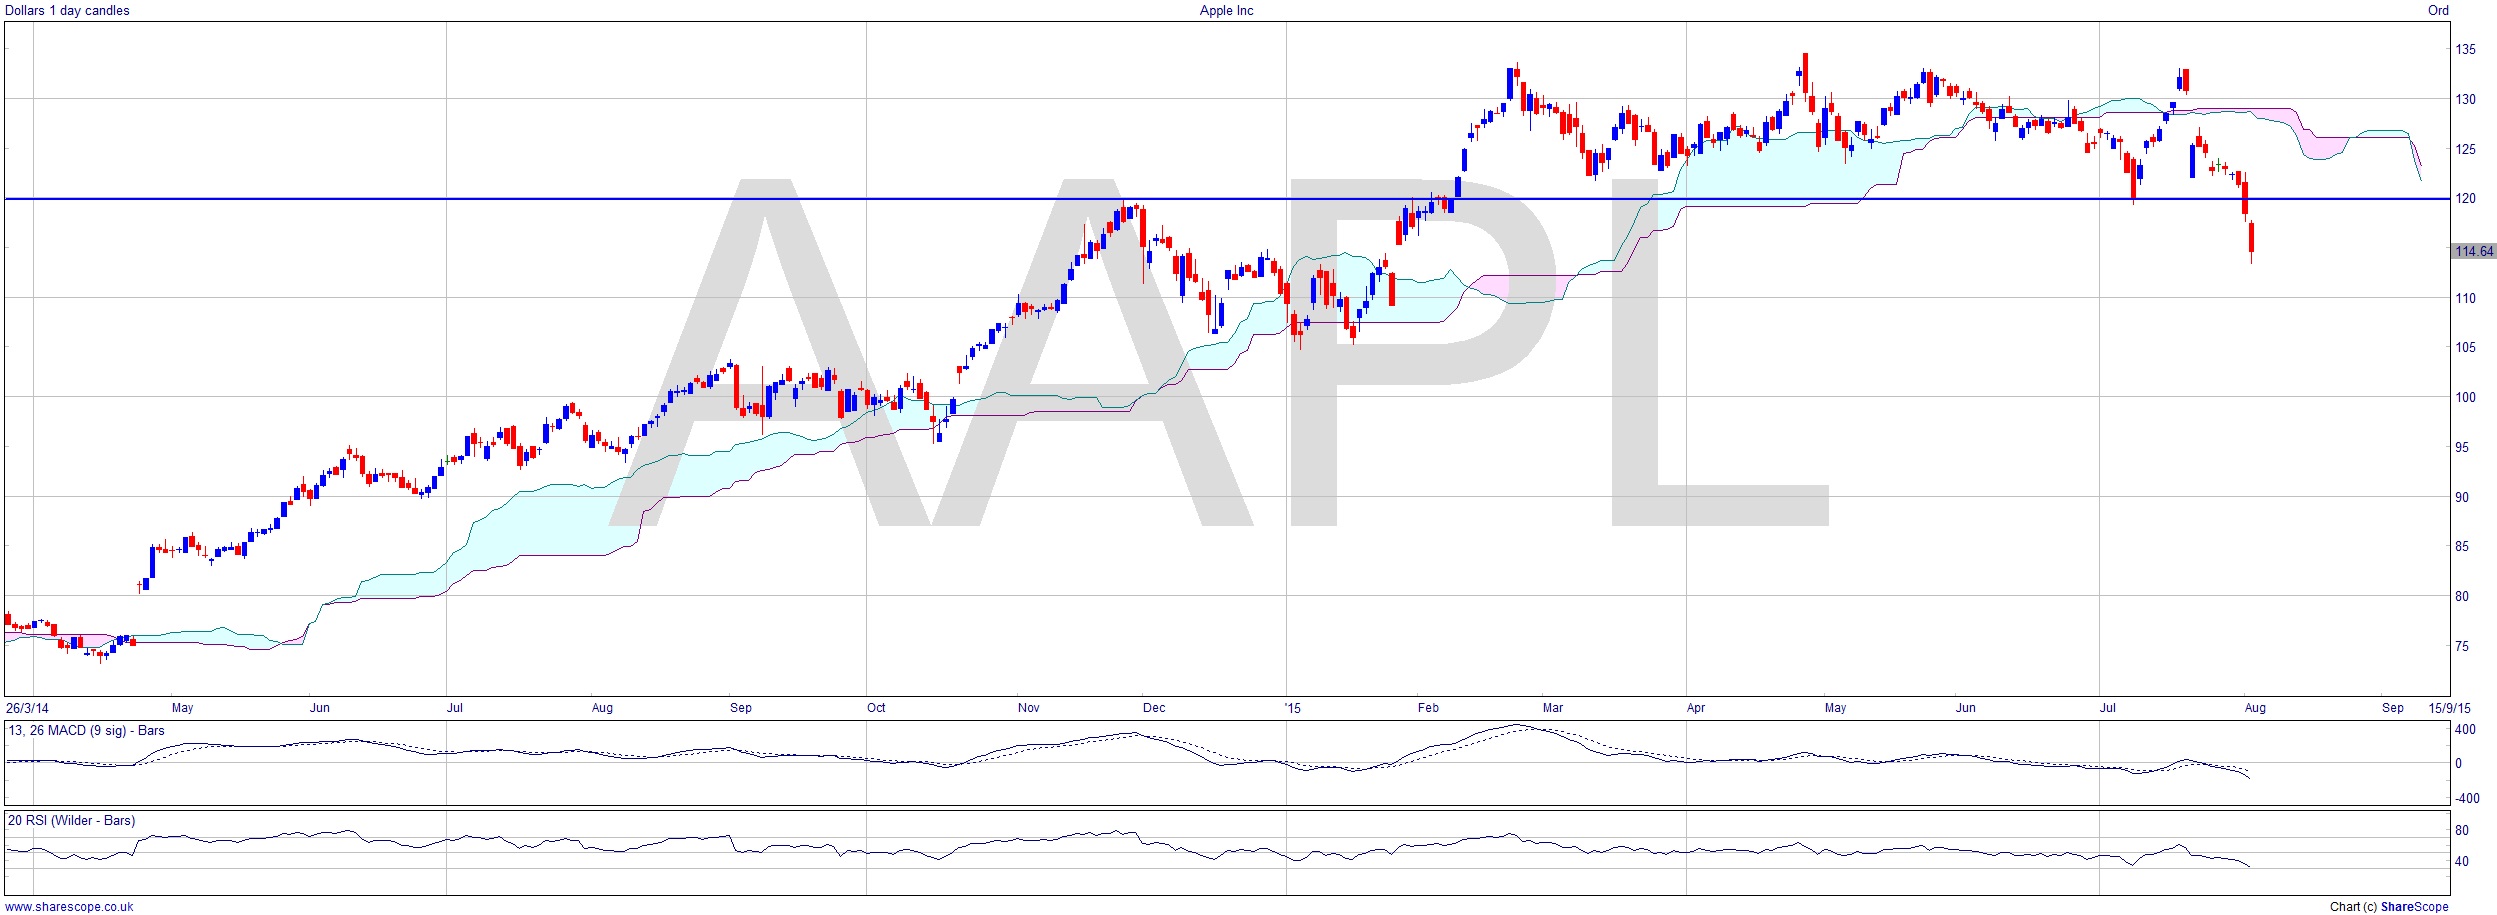
Apple seems to be struggling though. A bit of profit taking? Or a change in trend? The fall below $120 is significant, especially from a gap down. Apple has been the darling of Wall Street for so long, but could this be the tracing-out of a head and shoulders, with the right shoulder around $120? (And obviously a few heads –the more the merrier). I’m a big fan of spotting H+S early and getting in on the second shoulder rather than waiting for the Black Friday mentality that is the neckline. Get in on the shoulder, ride to the neckline and move the stop to breakeven (or profit). Then you don’t have to care if it completes or not, and if it does you are way ahead of the crowd.
Overall though the Dow chart says that the successes are outweighed by the failures and it’s going to be interesting to see what happens next. By the by, US economic policy is usually to make the stock market look good – sometimes, it seems, at almost any cost – and historically, Presidential election years are bullish.
Comments (0)