Westminster Group: Wedge breakout anticipated

I have to admit that the Twitterati I follow are increasingly an excellent source of charting material. At the very least they provide situations such as Westminster Group (LON:WSG), which one can then investigate.
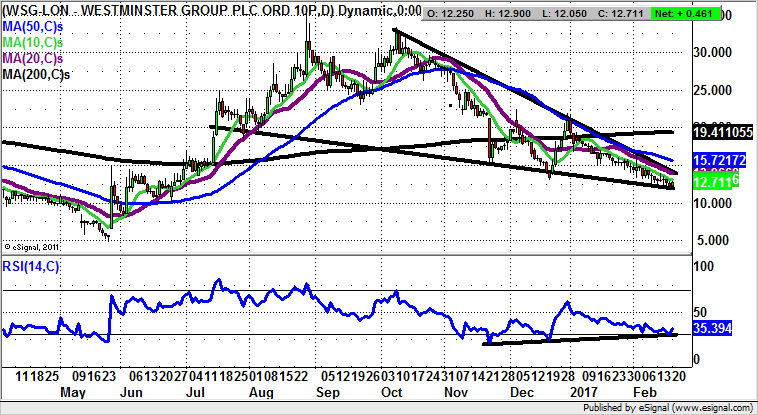
What can be seen on the daily chart of security group Westminster is that the shares have been in a holding pattern for quite some time. Indeed, the configuration we have been treated to over the past six months and more has been a bullish falling wedge.
The trick here, according to technical rules, would be to wait on a clearance of the top of the wedge at 14p, just above the 20 day moving average, on an end of day close basis before assuming that the next leg to the upside is on its way.
There are also a couple of other positive points regarding the charting configuration. For instance, it can be seen how last May delivered both an island reversal and an unfilled gap higher through the 50 day moving average. It was then at 10p, and it is now at 15.72p.
As for what may happen when/if the wedge is broken, given the presence of what I call a “rocket launcher” formation from spring last year, it could very well be the case that, backed by bullish divergence in the RSI window, we shall be treated to a retest of the 200 day moving average at 19.41p.
But it may be worth remembering that only a weekly close back above the 200 day line is likely to be enough to deliver a full blooded retest of the best levels of last year through 30p on a 2-3 month timeframe.

Comments (0)