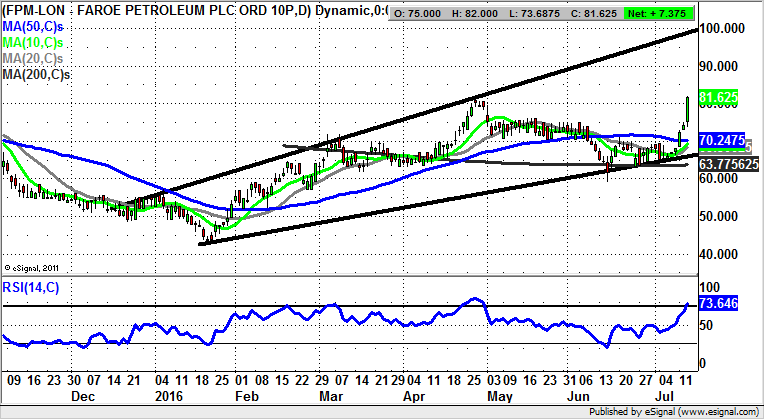
Chart of the Day: Faroe Petroleum

One of the better approaches to small caps is to focus on a few favourite examples of each sector and follow them through thick and thin. In the case of Faroe Petroleum in the recent past the good news appears to be that the stock has decoupled from the underlying commodity, at least for now.
Faroe Petroleum (FPM): Broadening Triangle Targets 100p
It would appear that fans of Faroe Petroleum have enjoyed a couple of decent and actually rather strong technical signals. The first was the mid-June one-day bear trap rebound from below the 200 day moving average now at 63.77p, and the second the unfilled gap to the upside to start this week through the 50 day moving average, currently at 70.24p. This combination has, not surprisingly, led to a decent acceleration to the upside for the shares, all of which has occurred within the main broadening December triangle formation – the pattern which has dominated Faroe Petroleum of late, and which appears set to do so for quite some time. Indeed, the expectation at this point is that at least while there is no end of day close back below the former June peak at 75p we should be treated to an acceleration to the upside, which could lead as high as the late 2015 resistance line projection now pointing as high as 100p. The timeframe on such a move is regarded as being as soon as the end of next month. At this stage, only cautious traders would await dips back towards last month’s resistance to improve the risk/reward of going long at these relatively elevated levels.

Comments (0)