Zak’s Daily Round-Up: RBS, IAG, AMA and SRSP

Market Position: Pound/Dollar below $1.41 Risks $1.36
RBS (RBS): Fundamental Collapse
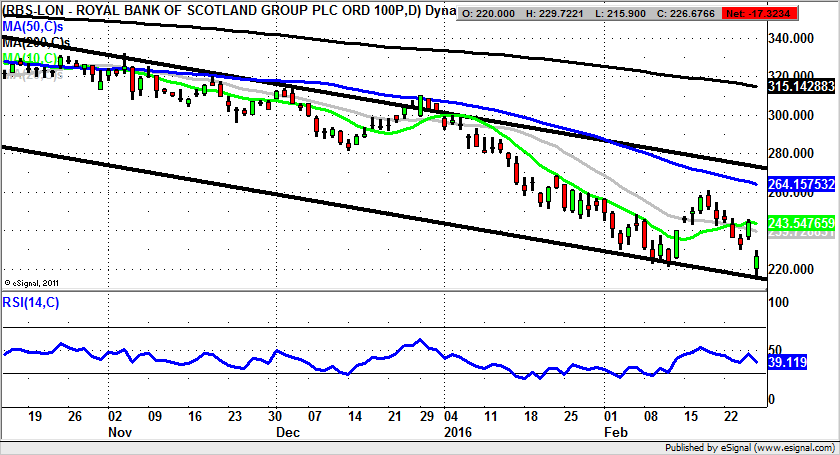
It may be conceded that at the time of the financial crisis eight years ago it seemed like a good idea to bail out or merge UK High Street banks. After all, the credibility of the UK financial system as a world centre for capital flight from around the world was at stake. After all, where else would Third World dictators, oligarchs and anyone else looking for a safe place to send their hard earned tax from emerging markets with geopolitical strife send their (tax paid?) hard earned cash? Not New York, Paris, Frankfurt or a Swiss Bank account, we hope. I would guess that bailing out RBS did restore confidence for would-be safe haven seekers in the First World, although they always had HSBC (HSBA) and Barclays (BARC). Indeed, that is the point. It was not as if the sector was bare even in 2008. Instead, the cost of bailing out RBS so far is £51.7bn, which the taxpayer has been liable for, and that is a lot of threatening letters from HMRC, a lot of tax on petrol, booze and cigarettes. Even worse, it could have bought a lot of A&E centres, heat for pensioners in winter, and vaccines for children. In fact, even the doubled £3.8m package for the RBS CEO could have done that. We have been treated to a near £2bn loss for which Ross McEwan has effectively been given golden handcuffs. At some point soon someone should make a decision as to whether the RBS experiment should be put out of both its and our collective misery. From a charting perspective it can be seen how there has been a descending price channel in place on the daily timeframe since June last year. The floor of the channel currently points at 215p, and this level was hit earlier today. That said, quite how the market can value this company at 215p, 15p or 2p is difficult to understand. The problem is that while below the overnight gap at 234p on an end of day close basis, the downside here would appear to be wide open – at least breaking the 200p zone.
International Consolidated Airlines (IAG): Possible February Gap Fill Below 500p
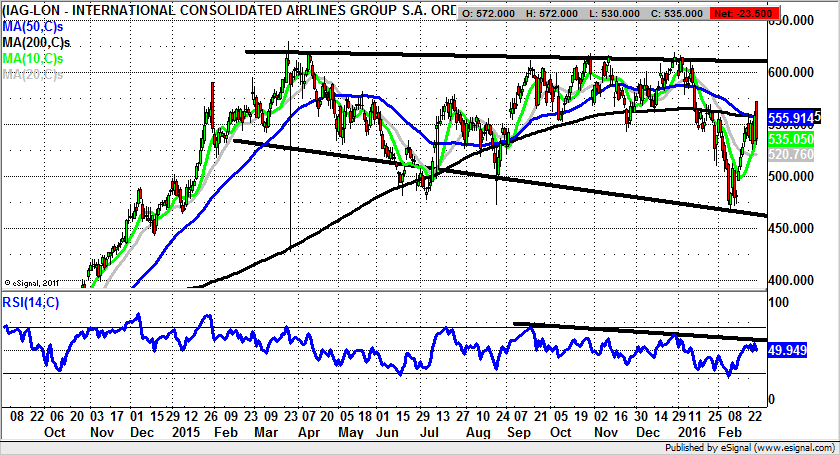
For International Consolidated Airlines it can be said that the past 20 years has seen the flag carrier come full circle, from being a Goliath in the face of the no frills carriers, to suffering at their hands, and then finally co-existing. Part of this has been a streamlining process, part a consolidation – most notably the takeover of Iberia. Those listening to the Today programme on Radio 4 this morning will have heard CEO Willie Walsh describe how all areas of ICA are now contributing positively. The only missing ingredient is perhaps the impact of much lower fuel prices, something which can be expected to be delivered over the next 1-2 years as hedged fuel costs at higher levels are taken out of the equation. The headline overall here though is that passenger revenues have risen by 14%, with the operating profit up to €2.34bn versus €1.39bn last year. This is some going, and implies that not only is this company on fire, but the sector revolution via the discount carriers continues unabated. But it may be that for now it is the charting position which fascinates as much or even more than the fundamentals. This is because we can see a dead cross sell signal between the 50 day and 200 day moving averages for earlier this week. The idea behind this is that there will at least be an intermediate period of weakness for the shares, especially as there has just been a bull trap through the 200 day line at 557p. On this basis one would suggest that provided there is no end of day close back above the 200 day line, there is the risk of a February gap floor fill down to 483p over the next 2-4 weeks. After this timeframe one would assume the shares might be able to head to the top of the main 2015 range at 600p once again.
Small Caps Focus
Amara Mining (AMA): 2015 Price Channel Target at 14p
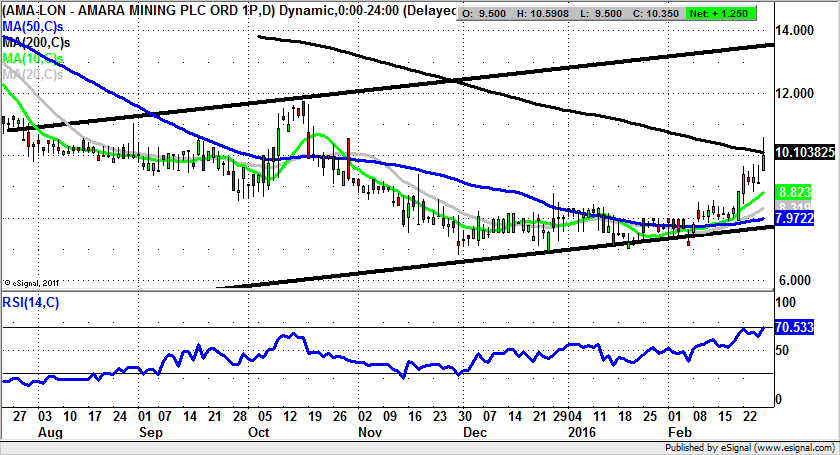
One of the happier aspects of the year to date has been the tentative recovery in mining minnows. One of the sturdier of these would appear to be Amara Mining, on the basis that the shares have served up an extended saucer base since the early autumn. The view at this stage is that things are looking increasingly encouraging, a point underlined by the way that the 200 day moving average at 10.1p is just being approached as the week ends. The ideal scenario is that for today or Monday we shall be treated to a clearance of the 200 day line, something which would open up the next stage of the rebound here. Indeed, it should be the case that above this key trend determining feature there will be a new leg to the upside within an overall rising trend channel in place since July last year. The top of the channel has its resistance line projection running as high as 14p, with this regarded as being the target to expect over the next 4-6 weeks.
Sirius Petroleum (SRSP): Broadening Triangle Targets 0.5p
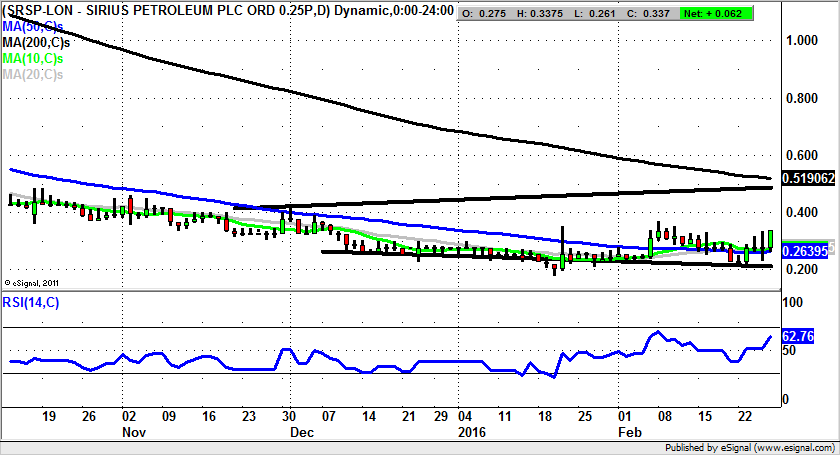
It has very much been a slow burn situation at Sirius Petroleum, something which is said on the basis of the extended base seen on the daily chart since December. This action has occurred within a broadening triangle, one which can be drawn in from just before Christmas. The big breakthrough in the near term has been the consolidation above the 50 day moving average at 0.26p. This suggests that provided there is no end of day close back below the 50 day line we should be treated to a three- month resistance line projection at 0.5p – just below the 200 day moving average at 0.51p. The timeframe on such a move could be the next 4-6 weeks.
Comments (0)