Zak’s Weekend Chart Round-Up

FTSE 100 Stocks
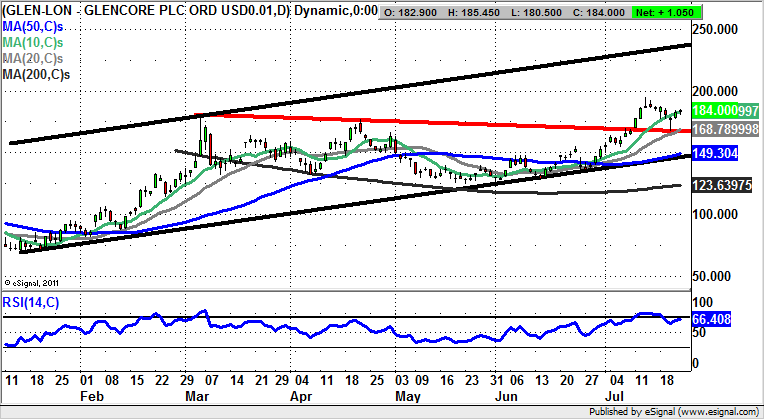
Glencore (GLEN): Above 170p Still Targets towards 250p
I have to admit that I have something of a Glencore obsession – an affliction exacerbated by the fact that earlier this year it did appear the company may succumb to a financial meltdown. But if the post financial crisis world tells us anything it is that in a near-zero interest rate environment all but the weakest can survive, indefinitely. The present charting position at the mining giant is that the shares have apparently taken heed of the previous message here “above 170p targets towards 230p” via a classic daily hammer candle on Wednesday. This delivered an intraday low of 167p – just below the notional new support, which comes in the form of a March resistance line, also tying in with the 20 day moving average at 168p. The view now is that at least while there is no end of day close back below the March support line we should see the gains which were anticipated previously, on the basis of the top of a January rising trend channel with its resistance line projection heading towards 250p. The timeframe on such a move is seen as being the next 1-2 months.
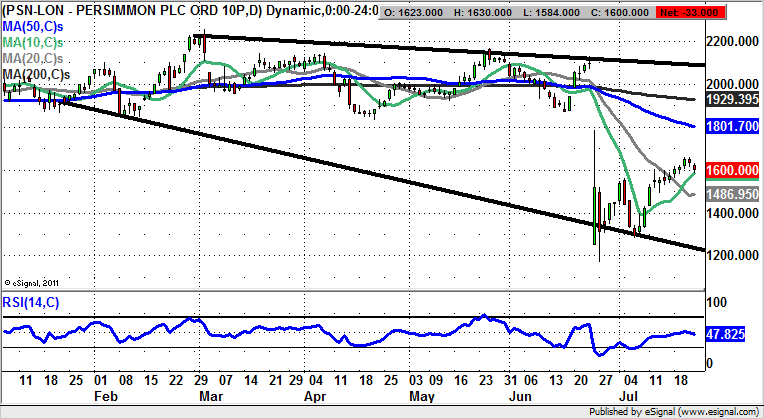
Persimmon (PSN): Above 20 Day Line Could Lead towards 1,800p
Given the way that there are only a few doomsters who actually think there will be a sizeable correction in house prices, the up to 40% decline in share prices for leading stocks such as Persimmon appears to have been rather overdone. That said, going against the grain of the stock market does not always pay dividends. In this instance, we have so far seen a reasonable bounce off the worst levels of the year just under 1,200p. The question now is whether after rallying 400p, the shares have done as much as can be expected after a dead cat bounce? The reason for caution here is actually as much to do with the way that for a year and more before the Brexit vote we saw a rolling top for the stock towards 2,200p. This was something which was all the more ominous given that expectations were for a Remain vote, which was seen as being positive for the sector. As far as the charting outlook is concerned, one can say that the optimists would be looking for a push towards the floor of the June gap to the downside at 1,783p. Rather helpfully this ties in with the area of the 50 day moving average at 1,801p. Together they provide for a one month target zone which is valid, despite the recent significant recovery, while there is no end of day close back below the 20 day moving average at 1,486p.
Vodafone (VOD): 270p Price Channel Target
The past year has been surprisingly dull as far as the price action of Vodafone is concerned, with perhaps the best that can be said being that the shares have been relatively stable compared with the stock market as a whole. This idea is backed by the way it is possible to draw a rising trend channel on the chart from as long ago as May last year. The latest gap to the upside for the stock in the wake of today’s trading update implies that positive momentum is back, and that provided there is no end of day close back below the 50 day moving average at 224p, the upside here over the next 2-3 months could be as great as the 2015 resistance line projection at 270p. Only cautious traders would wait on a clearance of the former April 236p peak before pressing the buy button, as a sign that the bears are finally on the run.

Small Caps
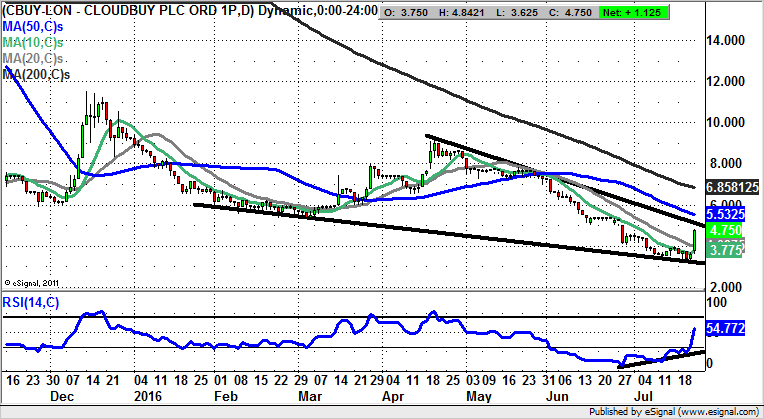
Cloudbuy (CBUY): Falling Wedge Reversal
As can be seen from the daily chart of Cloudbuy, since the spring of last year the share price has been on the back foot, with what at some points looked like it could be a terminal decline. But at least for now we have a decent charting pattern coming in the form of a bullish falling wedge within which the shares are already bouncing quite aggressively. The idea here is that as little as an end of day close above the resistance line of the February wedge at 5p could unleash significant upside. Just how high this could fly is suggested by the former April resistance at 9p. Those who are not feeling quite so ambitious might go for the 200 day moving average at 6.85p as the initial target over the next 2-4 weeks.
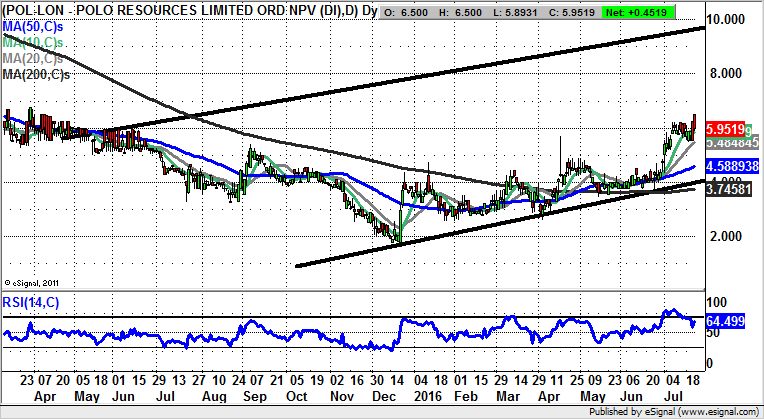
Polo Resources (POL): Technicals Point towards 10p
Polo Resources has been a slow burn turnaround situation in terms of the price action in recent months – so slow that in fact one can be forgiven for missing out on either commenting on the shares, let alone buying into the situation. The present position on the daily chart shows how there has been a continuation of the saucer shaped turnaround since December, with the view being that at least while there is no end of day close back below the former initial May resistance at 4.89p, we should be treated to an acceleration to the upside. Just how high the stock could fly is suggested by the May 2015 resistance line projection, currently pointing as high as 9.75p. This makes for a 2-3 months timeframe technical target.
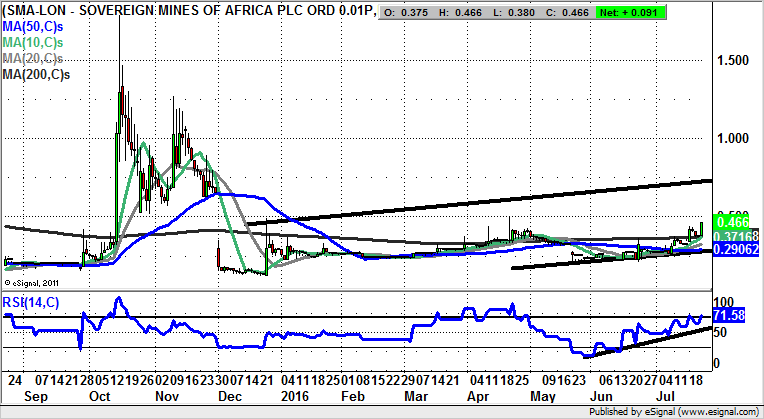
Sovereign Mines of Africa (SMA): Above 200 Day Line Targets 0.7p
A 200 day moving average break accompanied by decent momentum is normally a cause for celebration for a stock or market, and this is certainly the case currently at Sovereign Mines of Africa. What can be said is that following May’s exhaustion gap to the downside and the basing since, we would expect to see decent gains towards the top of a trend channel drawn from December. The resistance line of the channel is heading to 0.7p and this is expected to be hit as soon as the beginning of September.
Comments (0)