Turning Points in Commodities (Part 1)
")
Commodities have certainly been taking a bashing over the last few years. Oil is usually the headline commodity since it underpins such a lot of modern life, but there are plenty of others that we don’t just consume industrially. There are a lot of food commodities, for example. A number of these commodity charts are interesting reading just now, and possibly at a turning point.
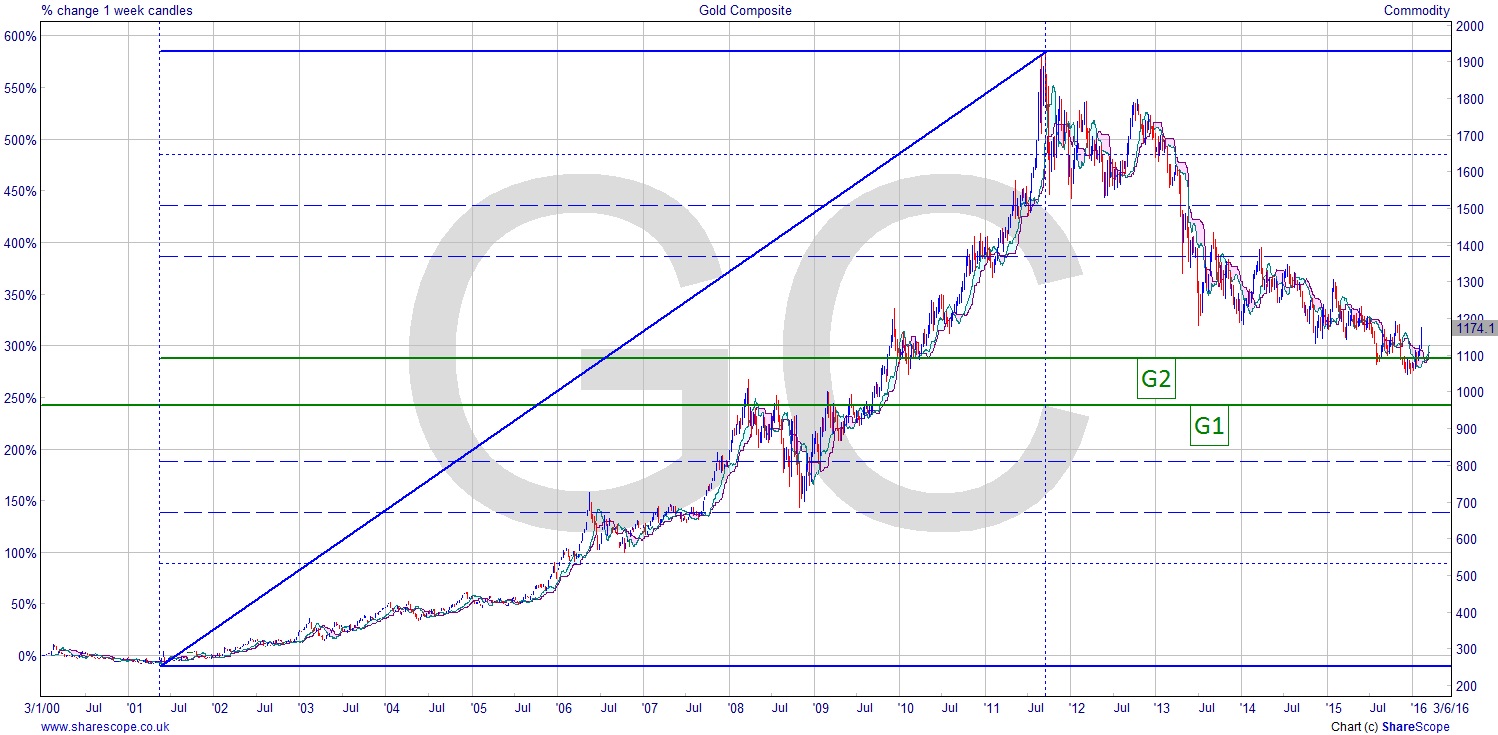
Gold [GC] is the most obvious anomaly when it comes to pricing. We know people east of Istanbul love gold as a store of wealth. We also know that Germany is slowly having (or hoping to have) its gold reserves returned from the US after Max Keiser scared them by asking if they knew where the German gold was. It turned out they probably didn’t, hence their wanting it back. China is stockpiling the stuff. Why then is the price depressed? I suspect it has a great deal to do with the paper market being out of balance with the physical market.
You could regard a paper market as the betting at a racetrack. It doesn’t affect the money the jockeys get if they win or lose, but it’s a separate market in a practical sense; it’s just based on the same underlying. That’s assuming the race isn’t fixed of course.
Important Gann levels on the Gold composite chart show that we are at G2 (50% between the ATH and ATL) and a little way above G1 (50% of the ATH). These are both key levels and if we see a failure at G1 then we would expect a further fall to around $450-$500. However we are not there yet. This would also be an important area of support. Although, for Gann to be working we would normally expect a very accurate reaction, and the price has played around all over G2, meaning it’s not working as a support level. So, G1 is the more likely support if it doesn’t recover from the rally we’ve been seeing just lately.
Coffee [KT], as a commodity, is not really in the public domain at all. But on this chart along with a number of others we are seeing an interesting development. The low on the Coffee Composite chart is around $100 and the current price around $123. There’s not much downside here. It seems doubtful that commodity prices can fall to zero, although anyone who was trading Natural Gas in recent years may have wondered. Soft commodities can be affected very quickly by global, or even localised, weather conditions, and we saw a very fast rally at the beginning of ’14, which was the result of a drought in Brazil. This year we’ve seen a lot of rain. But that could bring its own problems.
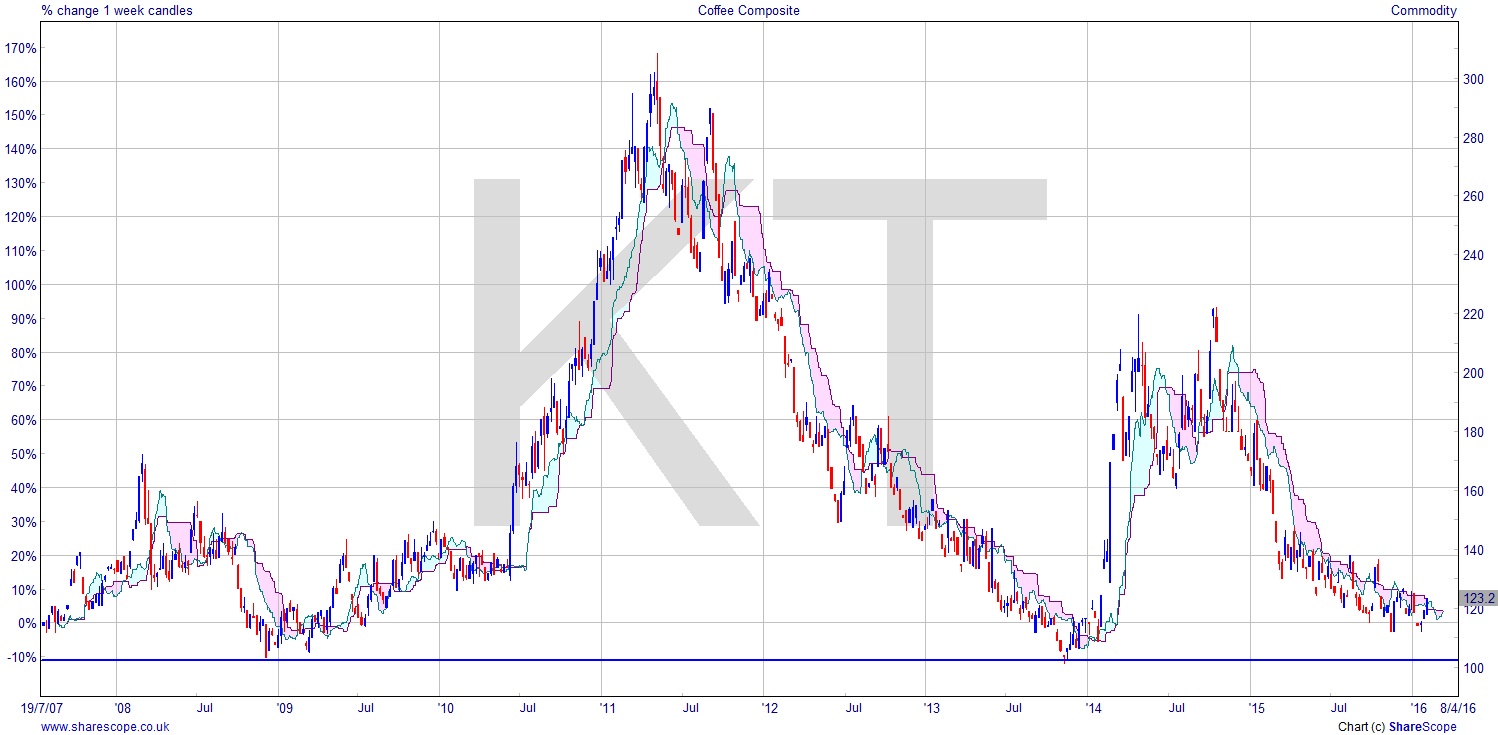
There doesn’t appear to be a lot of downside on coffee unless the price is going to collapse totally. That seems improbable with the amount of flooding and rain thanks to El Niño, which should have created imperfect conditions for growing most things. This means we have a $100 support level that’s not likely to be broken, and a huge upside.
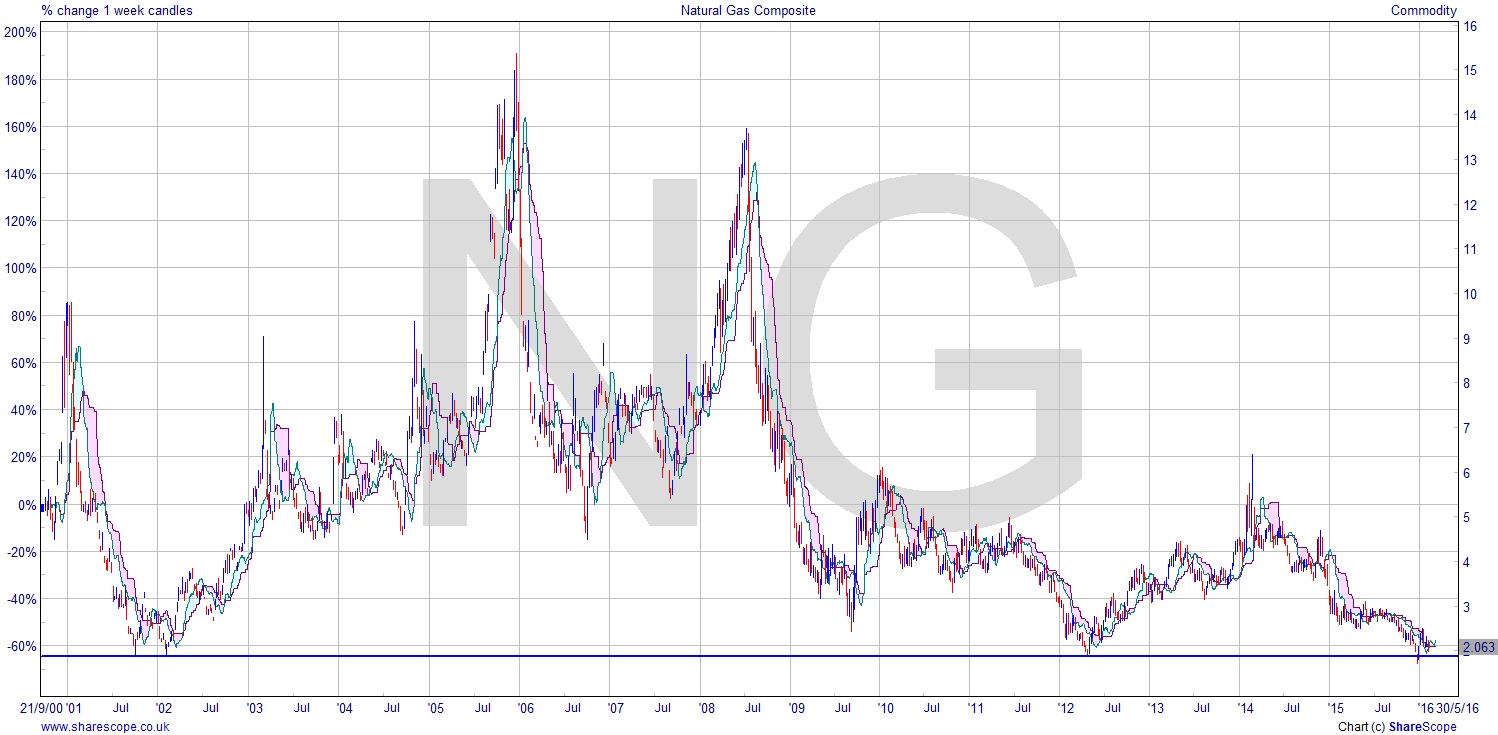
Coffee is not the only chart that looks like this. Natural Gas [NG] also fraternises with a now well established ATL. At a little below $2 we have now seen the fourth attempt on this support level. Could we see a fall here? Yes we could. A mild winter must have destroyed demand. And this recent fall actually dropped below the support level. This is certainly one to watch if you like commodities. And remember prices are never too low to go lower. A word to the wise though: as the price goes lower in any instrument, be careful that the spread isn’t starting to outstrip and affect your risk profile.
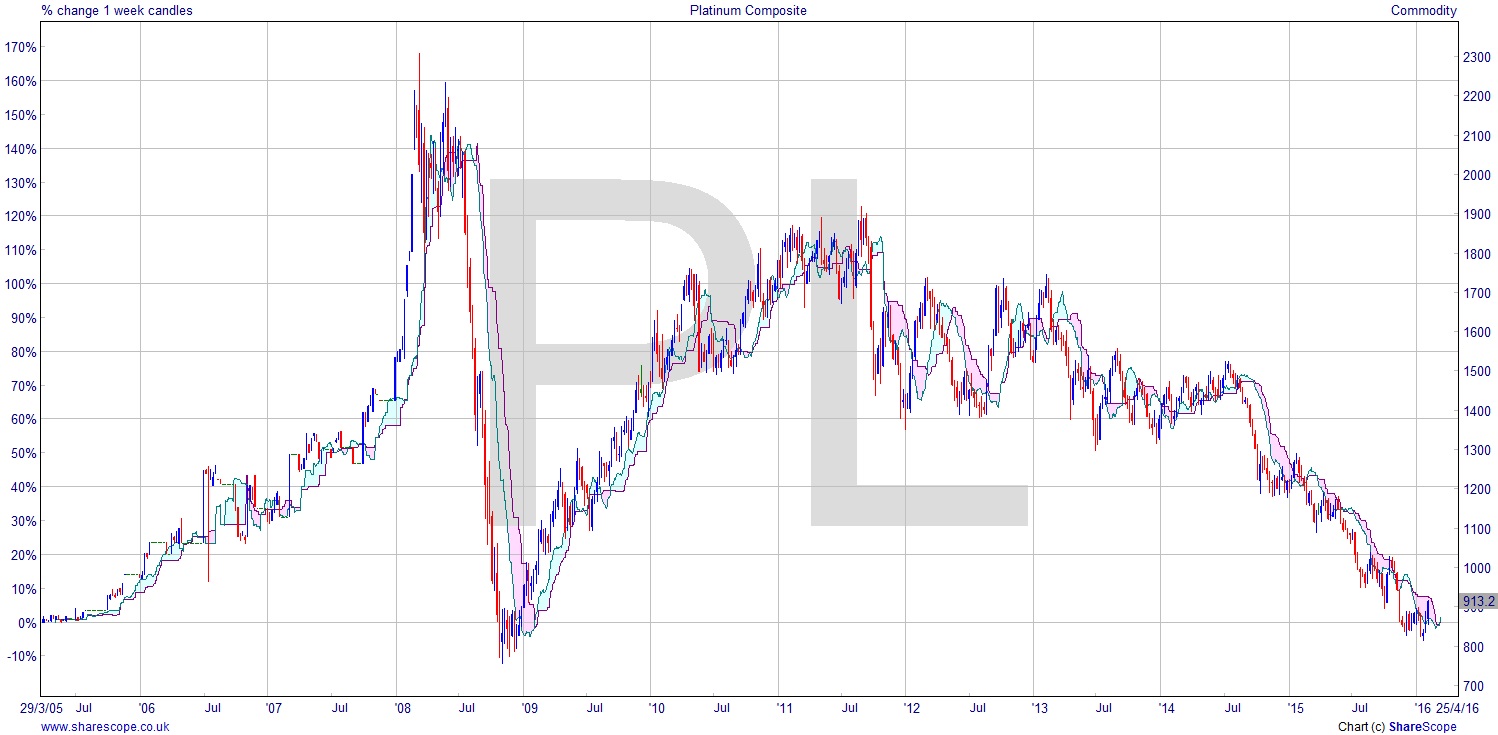
Interestingly Platinum [PL] is also in a similar position. The whole chart looks like a massive upside-down Cup + Handle – not a chart pattern to which I subscribe. I think it appeals to newbies because it’s very simple and visual. But the overall picture is of a bearish pattern. In a downward trend now for five years, it is almost at the support level that was set in ’09 at around $750. If it tests this level again, then we may expect a reaction one way or the other. Maybe even a congestion area, which could then help us with entry to the trade when it comes.
I’ll have a look at some other commodities in the next post as there are more interesting charts.
In answer to the inevitable question: I like my charts like I like my coffee: with tested support/resistance levels, no sugar (that’s next time).
Comments (0)