Zak’s Weekend Charts Round-Up

FTSE 350 Stocks
Lloyds Banking (LLOY): Above 50 Day Line Promises 65p Zone
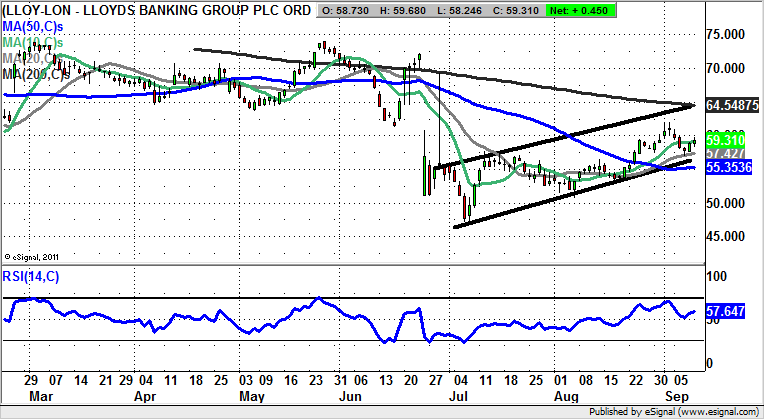
It would appear that shares of Lloyds Banking, and the rest of the High Street majors in its sector have staged something of a fightback over the summer. This is so even though it is rather difficult to think of a decent reason on a fundamental basis why this should be the case. Certainly, in the case of Lloyds Banking the last couple of months have been dominated by the alleged private life of the CEO Antonio Horta Osorio, who has revealed himself to be not so much a Black Horse, as a dark one. In terms of the price action of the shares on the daily chart we have a rising trend channel in place since the end of June. The floor of the channel currently runs at 56p, just above the 50 day moving average at 55.35p. All of this allows us to project shares up to the top of the three months trend channel, currently pointing as high as 64.5p. The time frame on such a move is regarded as the next 2-4 weeks, although one would only suggest this if Friday’s stock market declines really are a one day wonder.
Royal Bank of Scotland (RBS): 200 Day Moving Average Target
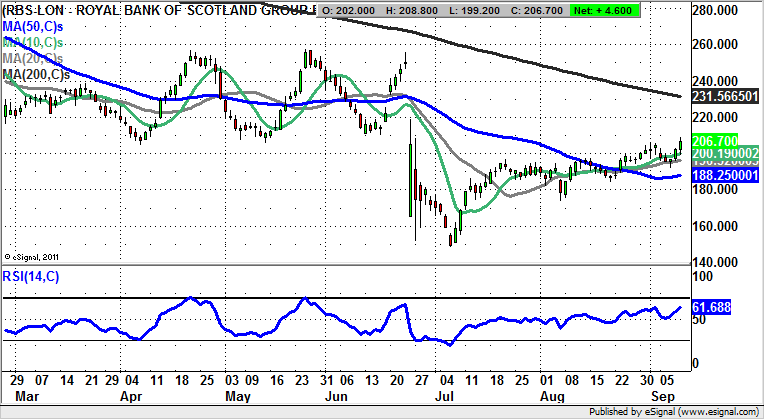
It is difficult to resist taking another look at the daily chart of RBS, given the way that at the end of a tough week on the stock market it managed to cover itself in price action glory. This is said on the basis that the stock was one of the FTSE 100’s biggest risers on Friday. The reason for the relative optimism is the way that the stock has remained above its 50 day moving average now at 188p for the best part of two weeks, with the key being a higher low put in above the 50 day line. The assumption to make now is that provided there is no break back below the 50 day moving average we can project the shares up to the 200 day moving average now running at 231p. Admittedly, this appears to be a long way away. But the set up is in place nonetheless.
Sports Direct (SPD): Above 50 Day Line Targets 350p Again
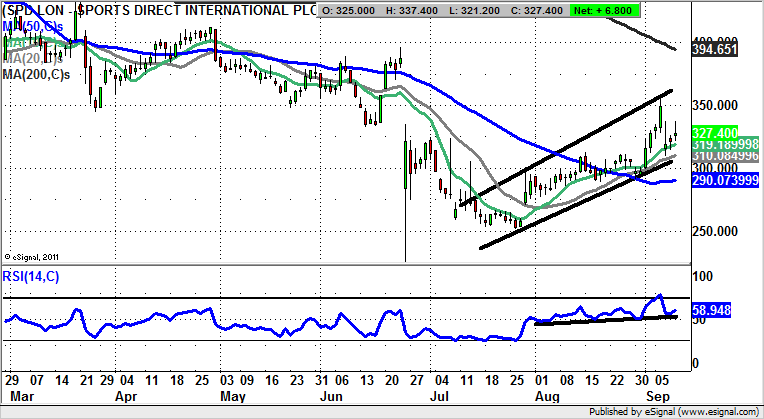
What can be seen on the Sports Direct daily chart, the Mike Ashley dominated retailer, is the way that we have a set up which is surprisingly similar to that of RBS (RBS) described above, even though the companies are clearly in totally different sectors. The reason for suggesting this is the way we have seen the shares dive in the wake of the Brexit vote, and then gradually crawl back. Arguably the highlight since the end of June has been the as yet unfilled gap to the upside at the end of July through the 10 and 20 day moving averages. This suggested significant momentum behind the rebound, as did the first time lucky recovery of the 50 day moving average last month, and the quadruple RSI bounced on the neutral 50 level over the summer. The implication is that provided there is no break back below the July price channel floor at 310p – level with the 20 day moving average, we should be treated to a push as high as the two month price channel top at 350p plus over the next 2-4 weeks.
Small Caps
European Metals (EMH): 45p Best Case Scenario Target
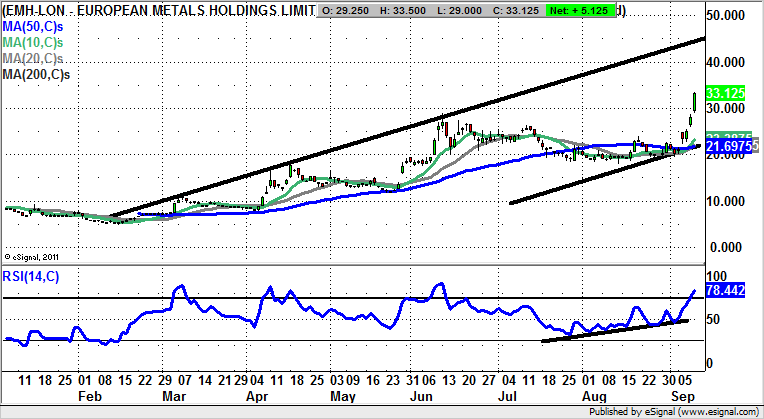
Given the way that charting small caps has become something of a speciality over the years, it is gratifying that in the recent past there have been some pretty decent contenders to call. One of the better ones so far in 2016. Indeed, the only slight disappointment was the sideways shuffle on the daily chart over the course of July and August. However, September has started off with a bang with three gaps above the 50 day moving average now at 21.69p. Helping build confidence is the way that there has been an easy clearance of the former June 27p peak. The idea now is that provided there is no break back below the 27p level on a weekly close basis the upside for European Metals is seen as being as great as the February resistance line projection currently running up to 45p. The timeframe on such a move is regarded as being the next 4-6 weeks.
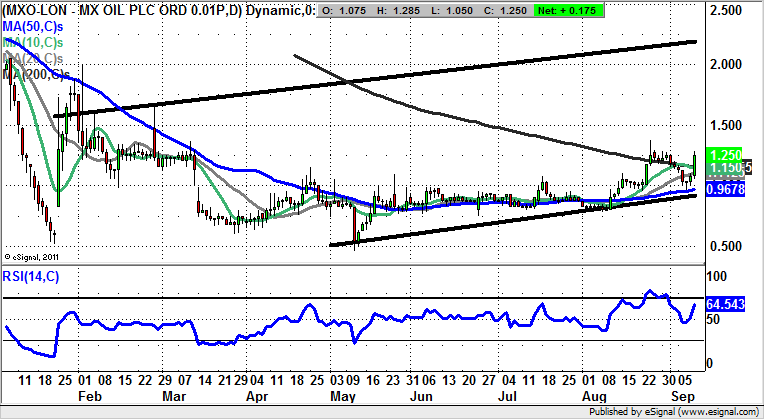
MX Oil (MXO): 2.25p Price Channel Destination
MX Oil has been both controversial and frustrating so far in 2016, but it would appear that at least from a technical perspective this situation looks to be resolving in a positive fashion. This is because it is possible to draw a rising trend channel on the daily chart from the beginning of the year. The resistance line projection of the channel is currently pointing as high as the 2.25p level, something which would take the shares back to where they were at the turn of the year. In the meantime one would suggest that at least while above the initial August 1.1p peak we should see shares of MX Oil head towards the top of the February price channel at 2.25p well before the end of this year.
Starcom (STAR): Above 200 Day Line Targets 4.5p Again
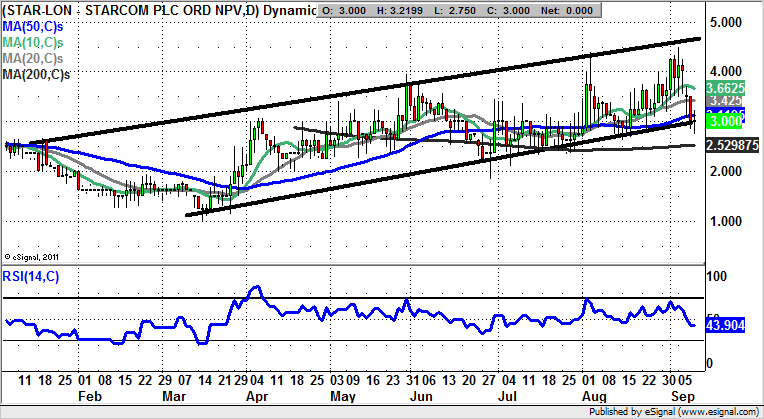
I have met and interviewed Starcom a few times now and still have the impression they do not charge enough for their remote tracking services. I understand the nirvana of recurring revenue, but in business it is vital to press home the advantage of pricing power when you have it. As far as the charting picture here it can be seen on the daily chart that the shares have fallen back to the floor of a rising trend channel, one which has its floor around the 3p zone. The view at this stage is that at least while the stock holds above the 200 day line at 2.52p it should be able to retest the best levels of the year to date at 4.5p. This is expected over the next 1-2 months.
Comments (0)