Zak’s Daily Round-Up: CCL, TUI, VOD, ALO, AO. and SGI
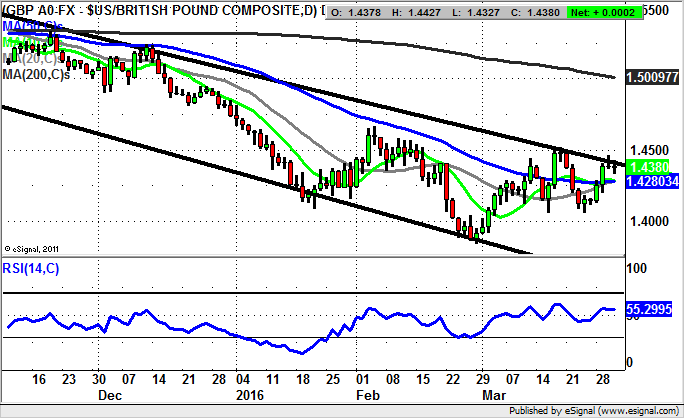
Market Direction: Sterling/Dollar Range under $1.4450
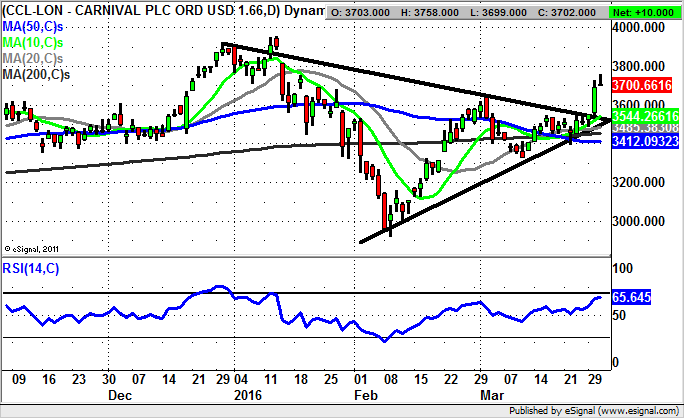
Carnival (CCL): Triangle Breakout Targets 3,955p
Carnival has of course been a decent play on the price of Crude Oil and geopolitical concerns, both of which have added to the volatility of shares in the cruise operator in the recent past. This is expected to continue to be the case for the foreseeable future. Perhaps the main point to note on the present configuration on the daily chart is the way that there has been a clear triangle breakout through a resistance line in place since the end of December. This line runs level with the 10 day moving average now at 3,544p, and the assumption to make is that provided there is no end of day close back below this notional double support, we are looking to further appreciable upside. The favoured destination at this point is for a return to the January 3,955p intraday high – the high of 2016 to date. Indeed, the best way forward from this point is probably to look for any dips to buy into towards the 10 day line to improve the risk/reward profile of going long after post February gains.
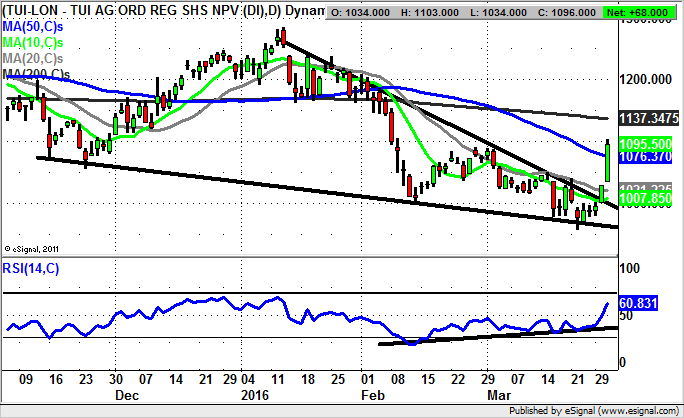
Tui (TUI): Wedge Reversal Targets Back to 1,200p Plus
Another leisure stock, another charting formation breakout. In this case it is a falling wedge formation, one where the break to the upside was anticipated by the uptrend line in the RSI window from February. This meant that we were reasonably confident of a break higher even before the January resistance line of the wedge was broken to start this week. The view now is that at least while there is no end of day close back below the overnight gap at 1,028p, we should be justifiably looking to further recovery. This is especially the case given the way that the RSI is only still at a relatively modest 60/100 even after the latest gains. In terms of what the upside here could be, the expectation is for a retest of the January resistance zone at 1,250p plus, a destination which could be achieved as soon as the end of next month.
Vodafone (VOD): 2015 Price Channel
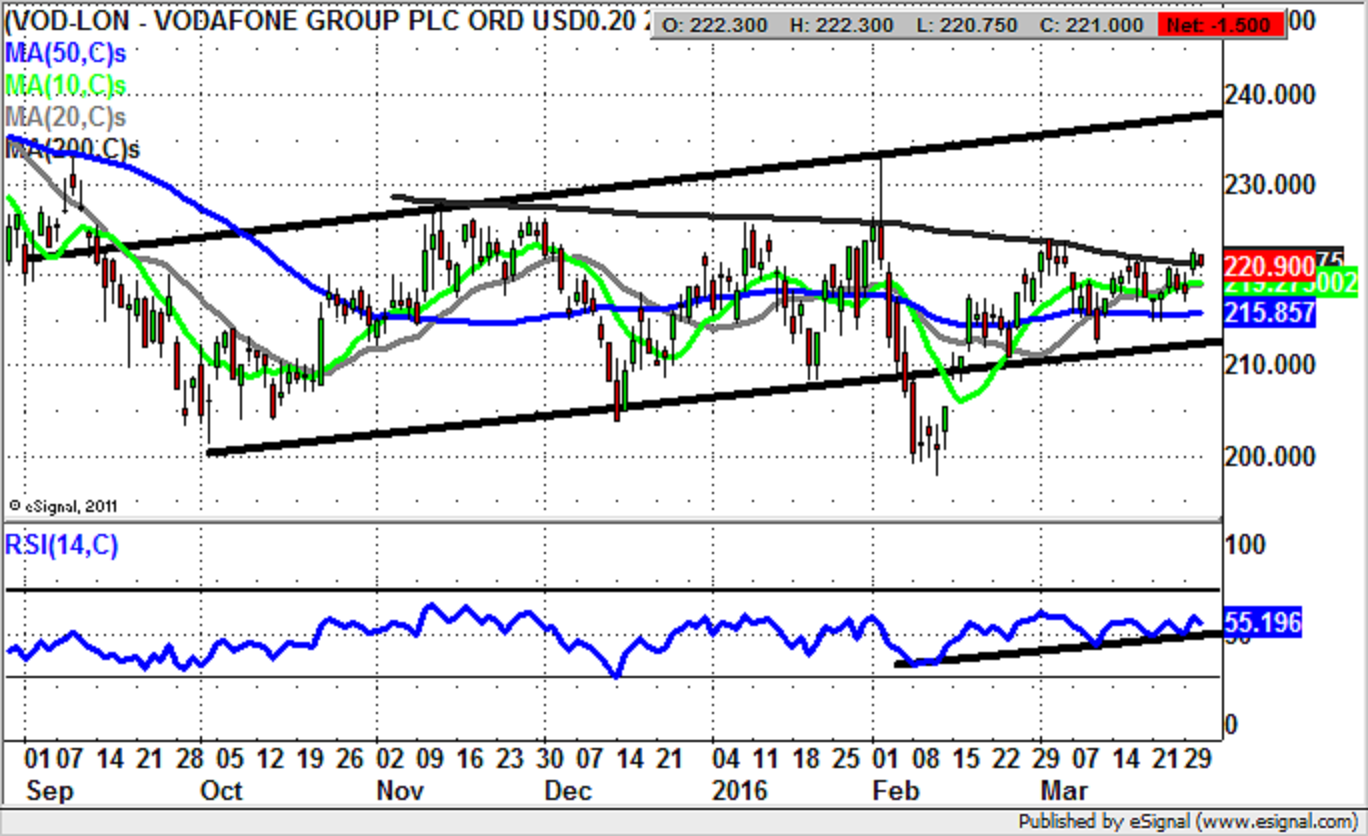
It is difficult to deny that shares of Vodafone have been something of a disappointment and a frustration all rolled into one. Indeed, the real downer here on a fundamental basis has been the combination of a lack of fresh fundamental drivers on an organic basis, as well as the come down from the hoped for significant M&A result from Liberty Global. What we have left after all of this is a company which is a chunky dividend play, and towards the floor of its recent range. Therefore, we are attracted to this situation as one of potential recovery, although the prospect of a swift improvement here seems a tough ask for the near term. Overall though, we have a mildly rising trend channel from September based at 212p, plus support from the 50 day moving average at 215p. The implication is that provided there is no end of day close back below the 2015 uptrend line we could be treated to a price channel top target as high as 240p over the next 1-2 months.
Small Caps Focus
Alecto Minerals (ALO): Broadening Triangle to 0.16p
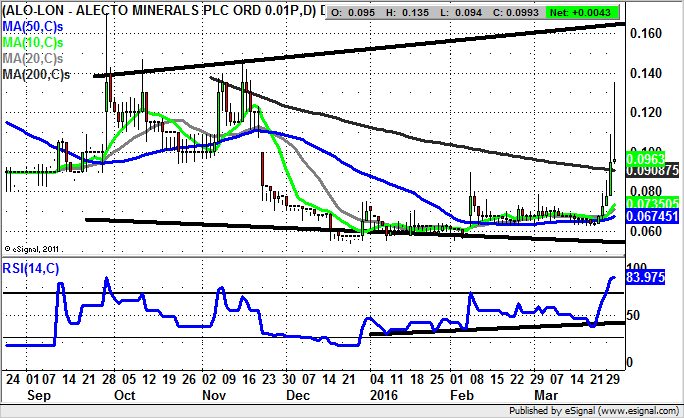
Ironically, given that I am a technical analyst, trading volume is not something which I find particularly helpful. This is because there can be the issue that a rising price on high volume is actually a buying climax – and the top of a move, with the opposite, heavy selling at the bottom of the range. However, Alecto Minerals was a standout in the sense that prior to the latest spike in the stock, we witnessed a surge in volume with a gradual push higher initially and then an acceleration. The view now is that we have seen a clearance of the former February resistance and 200 day moving average at 0.09p for this week. The likelihood is that provided there is no sustained break below the initial March resistance at 0.08p one would be looking for further upside. Just how high the stock could rise is suggested by the top of a broadening September triangle with its resistance line projection heading to 0.16p. The timeframe on such a move is as soon as the next 4-6 weeks.
AO World (AO.): Best Case Scenario Target 250p
It is evident on the daily chart trajectory of AO World over recent months that this has not been an easy contender for those in the shares. The massive gap to the downside in February last year underlines this point, with the hope being that the basing we have seen post August will be the start of a sustainable move/recovery. What helps underline this point is the way that the rise here has been flagged by an uptrend line in the RSI window which has been in place since as long ago as July last year. Such configurations are usually decent leading indicators on moves to the upside, with the hope being that while there is no end of day close back below the one year price channel floor at 166p/50 day moving average we can justifiably target fresh gains. This is even though for Thursday there has been a bull trap spike and failure from the 198p level. But at least for now we are looking to buy AO World shares on dips to the 50 day line, rather than thinking of a resumption of the bear move of last year.

Stanley Gibbons (SGI): Initial Positive Signs
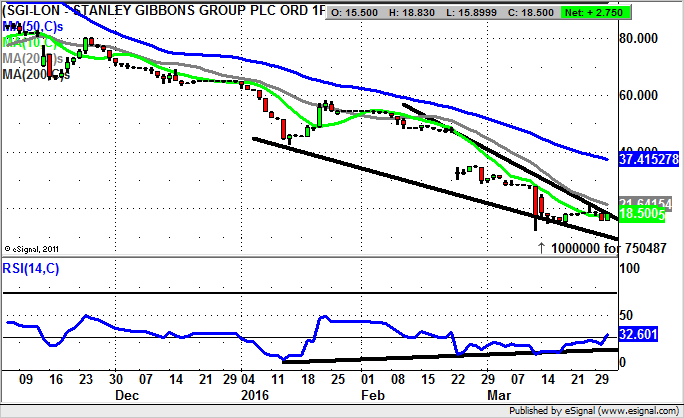
What has been interesting here for Stanley Gibbons in the wake of the thoroughly predictable meltdown (hot money running for the hills), is the way that the breakdown of recent months in the stock has been so relentless. The February gap down through former January support is a case in point. But before we give up the ghost entirely it is worth remembering that a weekly close above the February resistance line at 18.5p and a clearance of the 20 day moving average at 21.65p would be the first sign of an intermediate recovery. But at this stage the 50 day moving average at 37.4p is very much the best case scenario for battered bulls.
Comments (0)