Zak’s Daily Round-Up: CCH, RBS, RSA, EKF and XEL

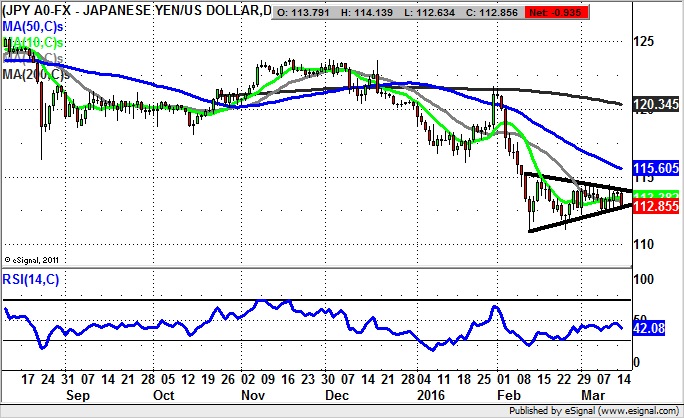
Market Direction: Dollar/Yen: Break of 112.50 Risks Sub 110
Coca Cola HBC (CCH): Imminent Breakout Expected
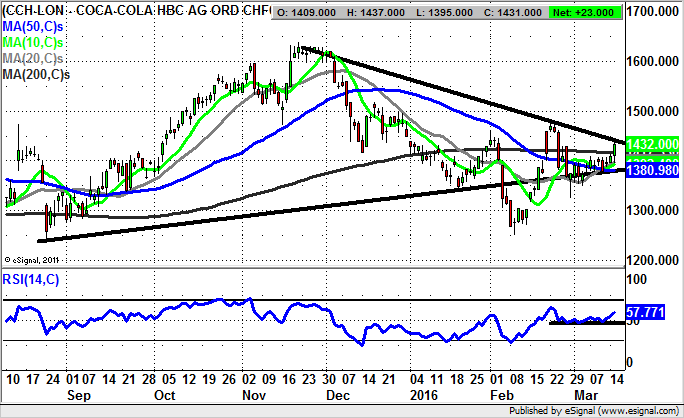
It may be no surprise that the present charting position of Coca Cola, the Dow constituent, has hit the top of its recent trading range and is threatening to break higher. As for the UK bottling group equivalent, we have a situation where the stock is off the top of the range, but appears to be poised very encouragingly. This is said on the basis of the latest break of the 200 day moving average, currently running at 1,417p. All that is really missing at this stage is a break of the main resistance line at 1,440p from November. The fact that the RSI is at 57/100 and well above the neutral 50 level suggests that we have a leading indicator on a possible break to the upside. This is expected while there is no end of day close back below the 50 day moving average at 1,381p/August uptrend line. Perhaps what is most helpful though is the overall pattern here since last month, with the bear trap gap reversal from below 1,300p, which suggests that the shares overshot to the downside to start 2016. As far as the potential upside is concerned, one would be looking to a return towards the main post November resistance at 1,600p plus. The timeframe on such a move could be 4-6 weeks or less after any November trendline break.
RBS (RBS): Artificial Intelligence Replaces Human Folly
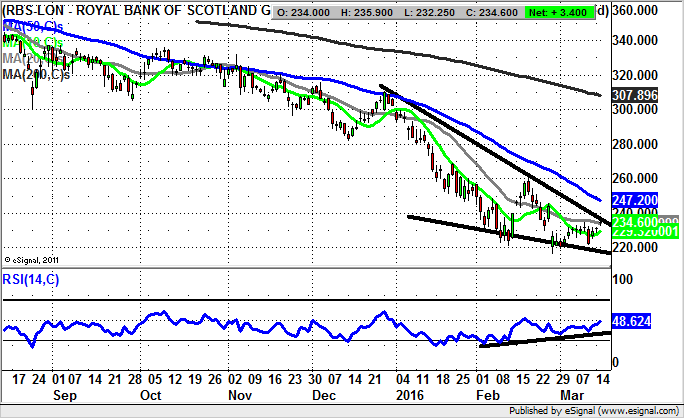
I think I have worked out the RBS strategy. This consists of replacing expensive money-losing humans with cheaper robots, who even if they prove to be a disaster could not be more disastrous than the last eight years at the 73% state owned bank. The powers that be at the zombie group, previously run by zombies for zombies, can now say that it has replaced zombie employees with artificial intelligence. As we are all aware, artificial intelligence is better than none at all. But the coup de gras here is that given HM Government is happy to plough billions of our HMRC cash into this black hole, if the Daleks on a helpline fail to do the business, management can at least say it was proactive in doing something constructive. As far as the technical position here on the daily chart is concerned, I am happy and slightly surprised to say that we have a possible positive reversal visible here. This is said on the basis that the shares are trading within a bullish falling wedge formation which has been in place since the end of December. However, the point to remember with such formations is that they are only really triggered by an end of day close above the top of the pattern. Otherwise, they are essentially just subjective parallel lines. Therefore potential fans of this situation may be wise to wait on an end of day close above the December resistance line at 235p, and even up to 240p to allow for wiggle room. The target on any clearance of this formation would be a retest of the February 260p resistance zone as a “minimum”. Otherwise, any break back below the floor of the wedge at 220p could signal fresh lows – the scenario that still seems to be the percentage trade on a long-term view.
RSA (RSA): Bull Flag Breakout Targets 500p
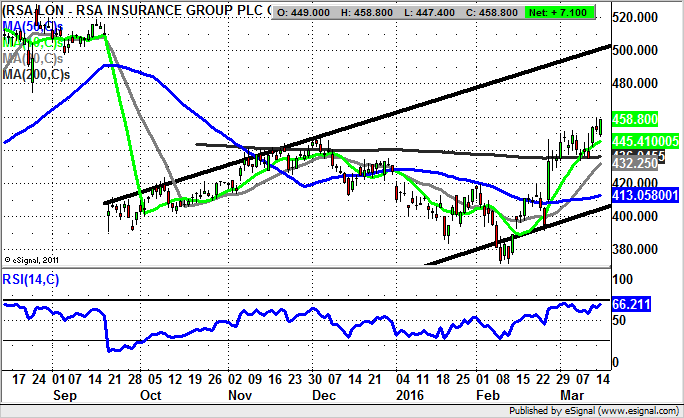
I have covered RSA shares here quite recently, but it seems that the setup is so compelling it is worth providing an update. This is said on the basis that we have a bull flag breakout for the stock, despite the rather weak stock market conditions. The reason for the relative enthusiasm is the way that we have the bull flag breakout occurring at and above the 200 day moving average at 436p, a formation which comes in the aftermath of a double gap to the upside off the lows of the year below 380p last month. Even more impressive is the way that to this day the gaps remain unfilled. This leaves us thinking that at least while there is no end of day close back below the 10 day moving average at 445p, there should be a relatively direct move to the top of a rising trend channel which has been in place since September. Its resistance line projection runs to 500p, and could be hit as soon as the end of April.
Small Caps Focus
EKF Diagnostics (EKF): Early Bird Buy Signal
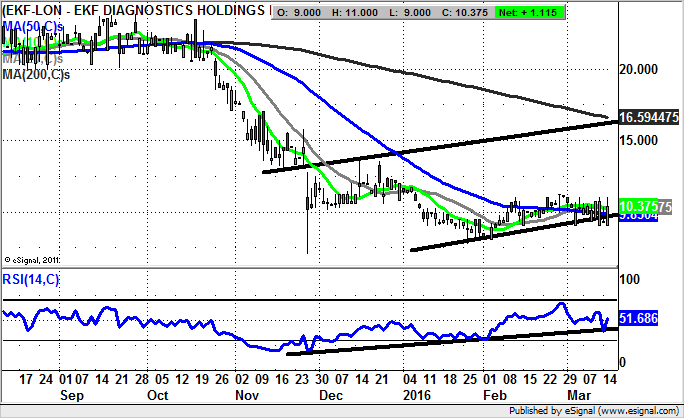
It may be a little on the early side to be looking at EKF Diagnostics as a recovery play, but the recent action does suggest that this stock is back in play for the bottom fishers. The main plus at the moment is the extended crawl along the 50 day moving average at 9.85p, with the view now being that while there is no end of day close back below this feature/rising trend channel from November, we should be treated to fresh gains. The favoured target over the next 1-2 months while the 50 day line is held would be towards the 200 day moving average at 16.59p.
Xcite Energy (XEL): Broadening Triangle Rebound Implies 30p Zone
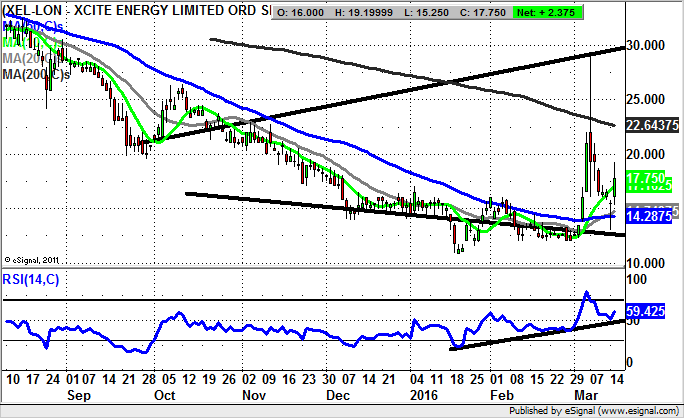
It has been quite a wild ride in the recent past for shares of Xcite Energy, with the journey for traders over the course of March to date being something of a roller coaster. But at least from the perspective of the bulls we have finally been treated to the kind of appreciation of the company’s prospects that one might expect given the clear potential of the Bentley Field – one of the North Sea’s largest assets. The situation has of course been hurt by the plunge in the price of Crude Oil, but even so, one would imagine that one day the value will out. As far as the latest technical position is concerned, we are looking at a rebound off the floor of a broadening triangle, one which has been in place for as long as the beginning of October. The hope now is that there will be no break back below the floor of the triangle ahead of a “minimum” retest of the 200 day moving average at 22.63p. Overall, the 2-3 months target is back to the top of the formation heading as high as 30p.
Comments (0)