Zak’s Daily Round-Up: BT.A, HSBA, AFC and PHE

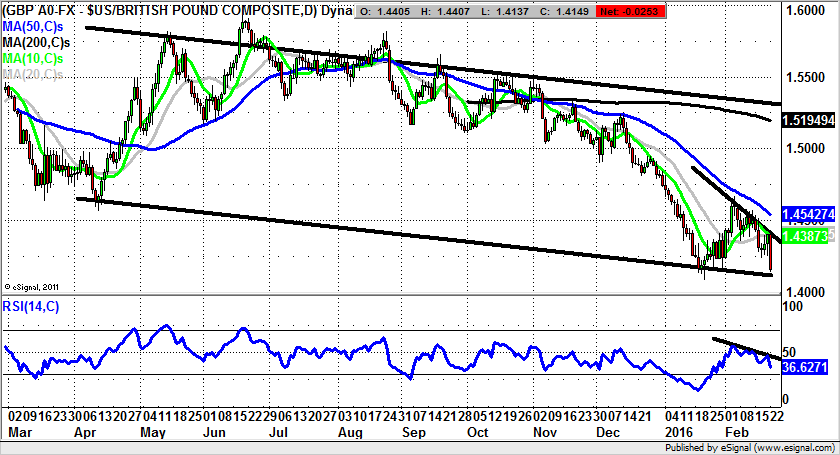
Market Position: Sterling/Dollar below $1.44 Targets $1.40
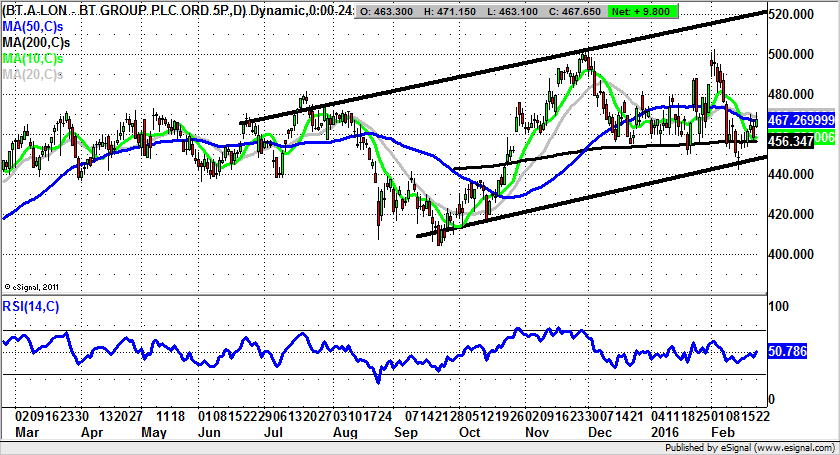
BT Group (BT.A): Above 450p Still Points to 520p
One of the alleged benefits of joining the EU, apart from the free trade, passport free travel and saving money on a single currency, was the idea that much of the “rip off” Britain issue would be addressed. Of course, they have not. Instead, we have managed to keep all the cartels, monopolies, duopolies, and imported a fair few EU rip offs, largely in the form of green taxes and anti-business / socialist measures of the paternity leave genre. All of this reminds us of the way that BT Group as British Telecom was a state owned monopoly rip off, and has been transformed into a privatised near monopoly rip off. Before it was a third world service provided at a second world cost, and now it is a second world service at a first world cost. Rural broadband and City blackspots actually make me wonder whether the second world description is appropriate. Essentially, the telecoms giant is too big to succeed in its function and has every incentive to do the least possible in terms of service. Therefore one should be all for the idea of a break up, especially after it managed to wangle the EE takeover. From a charting perspective it can be seen how there has been a rising trend channel in place on the daily timeframe since the summer. The floor of the channel currently runs at 450p, with the implication being that provided there is no end of day close back below this number, the upside here is called as high as the top of the trend channel with its resistance line projection heading as high as 520p – the 1 to 2 months timeframe target. Only cautious traders would wait on a clearance of the 50 day moving average at 467p before taking the plunge on the upside.
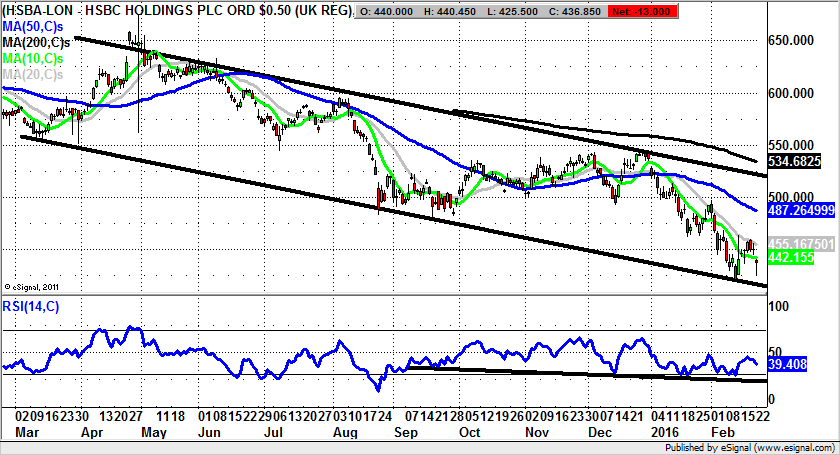
HSBC (HSBA): 420p Retest in Prospect
I suppose there are a couple of key takeaways regarding the latest update from HSBC, the Far East focused bank that recently chickened out of moving its headquarters out of the UK. The first is the way that the group has even after all its woes managed to notch up a £13.1bn profit. This is a massive number from what is a giant in the sector. However, it is likely that these woes are likely to get worse before they get better. This is especially the case given the way that Asia contributes well over three quarters of the profits at the group. In many ways it could be said that banking is dying or even dead in the non emerging markets space. Therefore, given the recent retracement in this zone we are forced to wonder how HSBC will manage to dig itself out of the financial hole it is currently in. Looking at the daily chart over the past year it can be seen how there has been a falling trend channel in place since before the summer. The floor of the channel currently runs level with the 420p zone, with the implication in the wake of the Monday gap to the downside being that provided there is no end of day close back above the gap at 444p, a retest of the worst levels of the year to date could be on the cards over the next 1-2 weeks. As things stand one would probably take the view that only sustained price action back above the 20 day moving average currently at 454p would really change the sell-into-strength technical pattern here.
Small Caps Focus
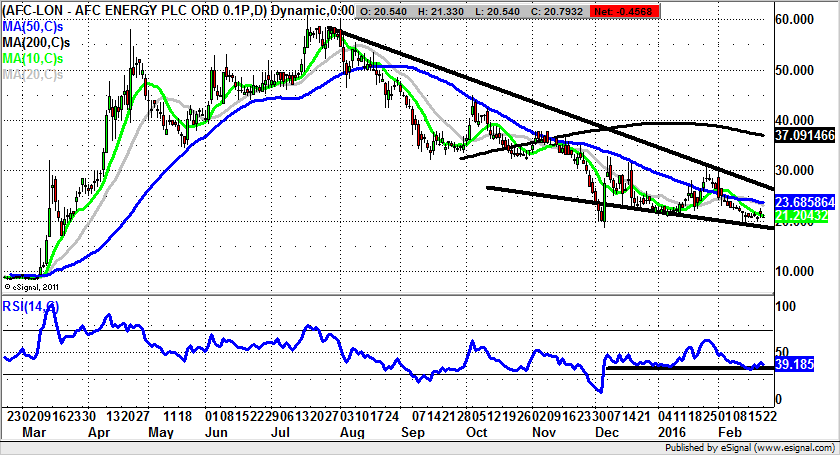
AFC Energy (AFC): Above 19p Could Lead to 200 Day Line
In order to add value in terms of technical trading calls it seems fair to mix up the momentum calls and the bargain hunting plays. One possible example of the latter is currently being highlighted for AFC Energy. Here it can be seen how we have a progression within a falling wedge formation, one which has been in place on the daily chart from as long ago as August last year. The floor of this likely positive reversal formation currently runs at 19p and is backed by an extended RSI support line running at 35. All of this should combine to ensure we will at least see an attempt on hitting the top of last year’s formation at 26p. This would of course offer a reasonable return from present levels. However, the big prize would clearly be the aftermath of a weekly close above this level, something which would imply a considerable degree of strength for the bull argument in terms of momentum. A break of 26p could lead AFC Energy shares back up to the main post-November resistance at 37p – level with the present position of the 200 day moving average.
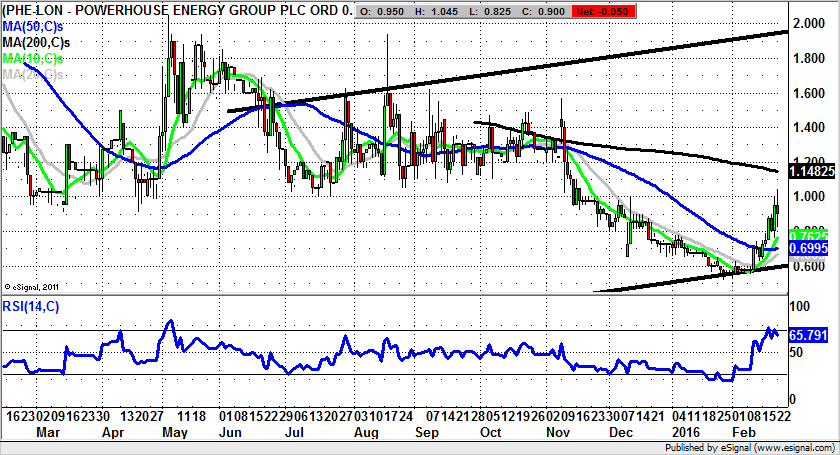
Powerhouse Energy (PHE): Above 50 Day Line Leads to 2p Zone
What can be said for the daily chart of Powerhouse Energy is that we should be looking at a classic recovery situation. This is especially the case given the way that the shares have managed to melt through the 50 day moving average at 0.69p. The consolidation we have seen so far since is a relatively clean one, without the need for a test for support. The assumption to make now is that while there is no end of day close back below the 50 day line we have an initial post-October resistance target of 1.4p plus over the next month. Otherwise a weekly close above 1.4p could then lead to the top of last year’s trend channel and range at 2p – given the implied clearance of the 200 day moving average in this are at 1.48p. Indeed, it could be the case that cautious traders wish to see a clearance of the 200 day line before regarding this as a bona fide bull prospect.
Comments (0)