Zak’s Daily Round-Up: BARC, HSBA, STAN, BPC and AERO

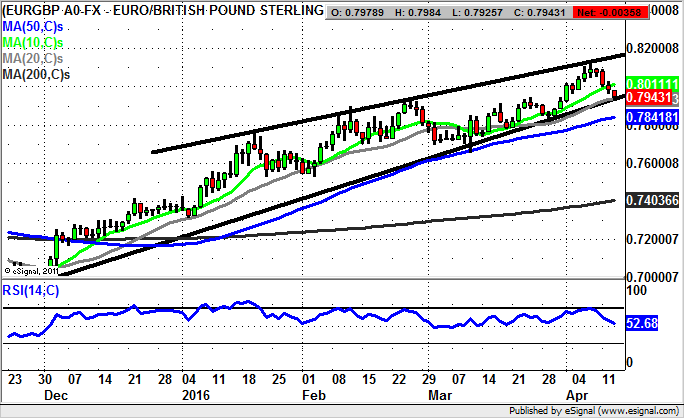
Market Direction: Euro/Sterling Key 79.4p Support
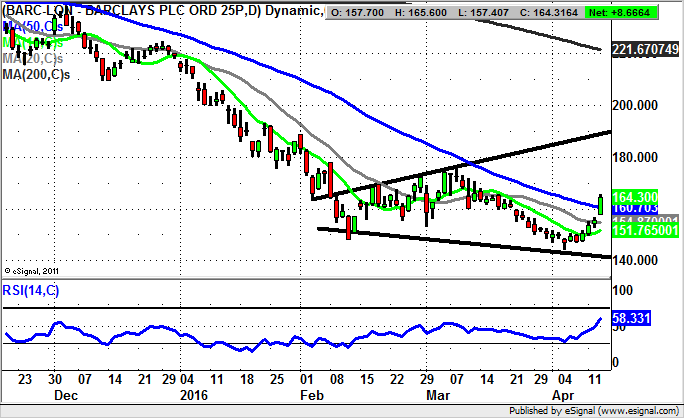
Barclays (BARC): Broadening Triangle Target of 185p
I must admit that I have enjoyed the latest Barclaycard spin off story regarding Barclays. Of course it should be said that in terms of a company having the brains to realise the asset that it is sitting on, this example should be rated 1/10 at the most!
Looking at the daily chart of the UK bank it can be seen how the coinciding of the “penny dropping” in terms of the value of Barclaycard, and the price action reaction, we are looking at a very significant event indeed. The view now is that the shares are in a broadening trend channel, one which has been in place since as long ago as the beginning of February.
The resistance line projection of the triangle is currently pointing as high as 185p, with this expected to be the 4-6 weeks time frame target. This is especially the case while the stock remains above the neutral RSI 50 level versus 59 currently, and while there is no end of day close back below the 50 day moving average at 160.73p.
What also helps is the way that the latest rebound for the shares has left an unfilled gap with its floor at 156.75p. Only below this would really suggest that Barclays has really run out of steam as far as the latest recovery attempt.
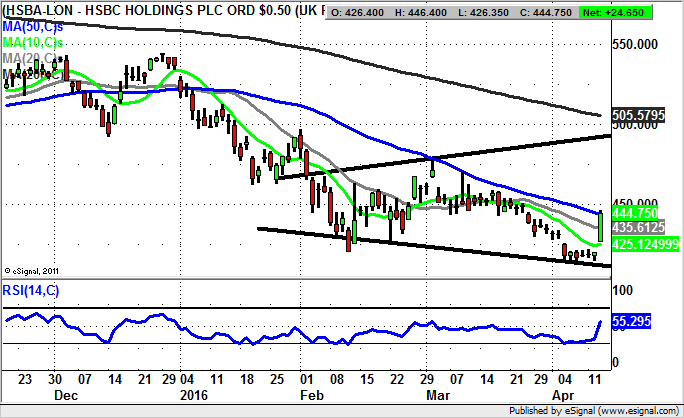
HSBC (HSBA): Island Reversal
For bulls of HSBC it has not exactly been pleasant ride, a point which is highlighted by the way that the shares have not been able to sustain the 200 day moving average, now at 505p, since as long ago as last June. However, for April to date we have seen a rare and positive setup, especially with relation to the former February floor at 420p.
This is because for April to date we have been treated to an island reversal formation which is been a bear trap from below the old February floor, and below the 10 day moving average at 425p. The view at this stage is that at least while there is no break back below the 10 day line, we could be treated to upside is great as the 200 day moving average at 505p.
The fact that the RSI, now at 56.71/100, has pushed back above the neutral 50 level suggests that shares of HSBC have finally made a lasting floor, even though this is still well below former early 2010’s resistance.
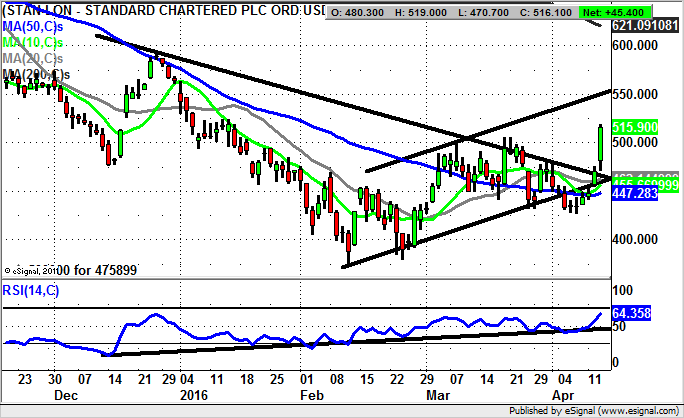
Standard Chartered (STAN): Triangle Break
Shares of Standard Chartered have not exactly been an easy contender over the recent past, a point which is underlined by the way that for March/early April we have seen a slow decline continuing off the autumn 2015 break down, which would most likely be stopped in its tracks in the wake of the latest triangle break.
This formation has been in place from as long ago as the beginning of the year with the resistance line question currently running level with the 20 day moving average at 462p.
The best that can be said at this stage is that provided there is no end of day close back below the 20 day line, one would be looking for further significant upside, especially given the way that the shares have been caught in a particularly narrow range over the past couple of months.
Nevertheless, the expectation over the next 1 to 2 months is that provided there is no end of day close back below the initial April resistance at 479p, we could be looking towards the 200 day moving average at 621p over the next 1 to 2 months.
This is regarded as being the case especially while there is no break back below the 505.5p resistance of March, which would potentially unleash a significant and speedy move as high as the 200 day line.
Small Caps Focus
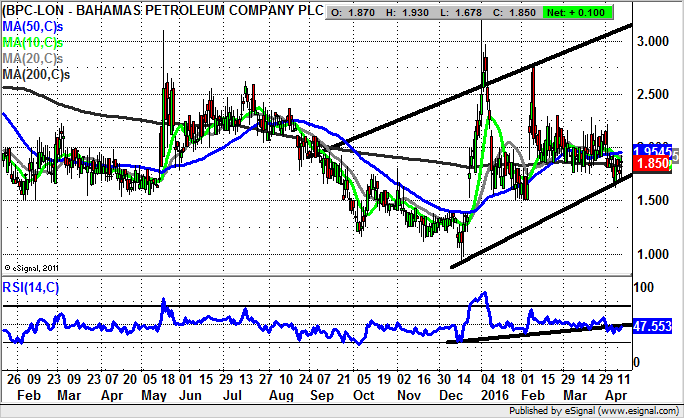
Bahamas Petroleum (BPC): 2015 Price Channel Target at 3p Plus
Shares of Bahamas Petroleum have not exactly been an easy contender for technical analysts to grapple with over the recent past. This comment is made in the wake of the latest April bear trap rebound from below the 10 day moving average at 1.5p.
While this is the case in terms of the tentative recovery, one would expect that the shares will be able to head as high as the top of a rising trend channel which has been in place on the daily chart since as long ago as September.
This has its resistance line projection heading as high as 3.2p, with the time frame on the upside scenario being as soon as the next 1 to 2 months.
Only cautious traders would wait on an end of day close back above the 50 day moving average at 1.95p before taking the plunge on the upside. As far as risk management is concerned at this stage only a weekly close back below the former initial February support at 1.5p would even begin to cast the bull argument into doubt.
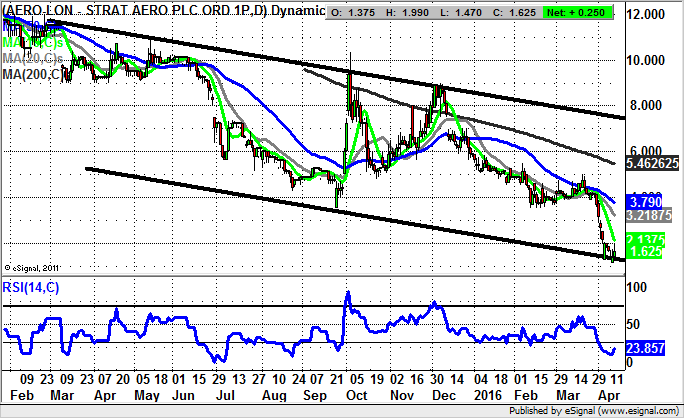
Strat Aero (AERO): Price Channel Support towards 1.5p
What can be seen on the daily chart of Strat Aero is the way that we have been looking at a rather unpleasant price action trajectory over the past year, with the most unfortunate periods being the bull traps through the 200 day moving average in October and December. Indeed, this feature still lies well above the current price action 5.46p. As far as looking on the bright side of the price action currently, it may be said that for the start of April we have seen a tentative rebound of the floor of a falling trend channel on the daily chart since this time last year heading towards 1.5p.
The ideal scenario is that there is no weekly close back below the floor the channel, especially given the way that the RSI now at 23.85/100 is extremely oversold. But it may be that cautious traders wish to see at least an end of day close back above the 10 day moving average at 2.13p before pressing the buy button on a potential recovery at Strat Aero.
Comments (0)