Zak’s Daily Round-Up: ANTO, ISAT, RBS, CNEL, MOGP and ROSE

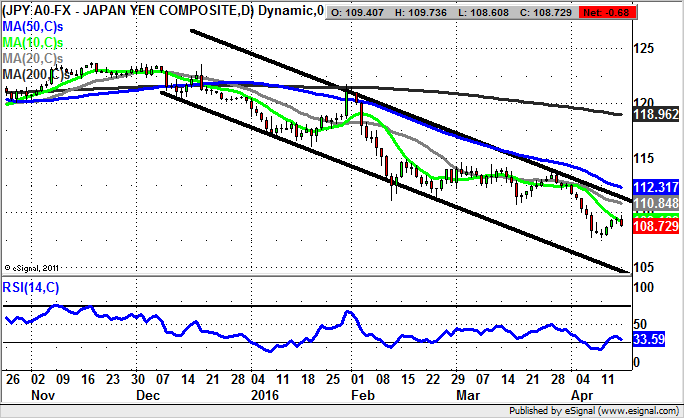
Market Direction: Dollar/Yen below 110 Still Points to 105
Antofagasta (ANTO): 640p Destination
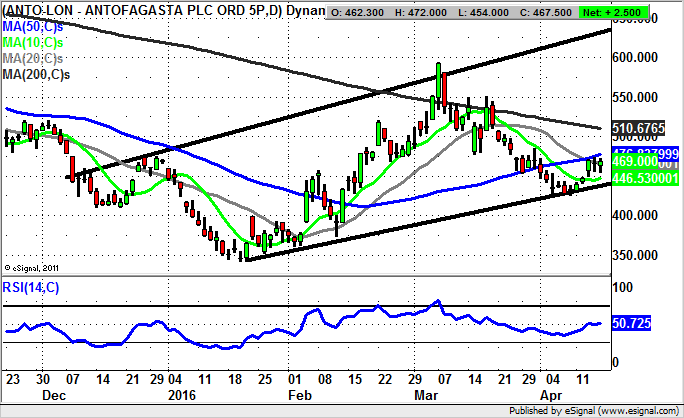
What is interesting about the daily chart of Antofagasta currently is the way that, as one would expect, the daily chart configuration over the recent past mirrors what we have seen in contemporaries such as Glencore (GLEN), Anglo American (AAL) and many of the leading mining sector plays. Indeed, what we see here is progress within a rising trend channel in place since as long ago as December, with the floor of the channel currently running level with the 10 day moving average at 446p.
What we would like to see over the next couple of sessions is a recovery of the 50 day moving average at 476p to leave the shares on to what should be a decent two weeks target at the 200 day moving average at 510p. The reason we are looking towards the 200 day line is that this blocked the price action in March and will pull it down, at least initially later this month. After that, the peak target here is back towards 640p at the top of the late 2015 price channel. In the meantime any dips towards the 10 day line are regarded as buying opportunities with only an end of day close back below this feature really questioning the recovery argument.
Inmarsat (ISAT): Bear Trap Island Reversal
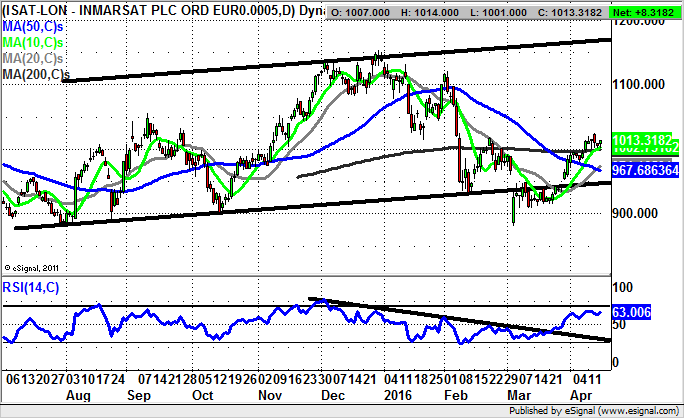
As can be seen on the daily chart of Inmarsat, this has been a happy recovery situation over the past couple of months, and for several reasons. The main one is the recovery of a rising trend channel which has been in place since as long ago as July, with the price action for last month taking the form of a bear trap island reversal, one of the stronger configurations in the charting book. The way that the December RSI resistance line was broken in late March when the shares were still well below 950p was also a decent leading indicator on a potential rebound.
The present situation is no less intriguing given the way that we have seen several days with the price action bouncing off the 200 day moving average at 999p, and taking the form of a Bull flag. The view at this stage is that while there is no end of day close back below the 200 day line we should see a return to the top of the late 2015 range at 1,150p. Indeed, only sustained price action back below the 50 day moving average at 967p, as a dynamic trailing stop loss, would really delay the upside scenario.
RBS (RBS): Wedge Breakout towards 250p
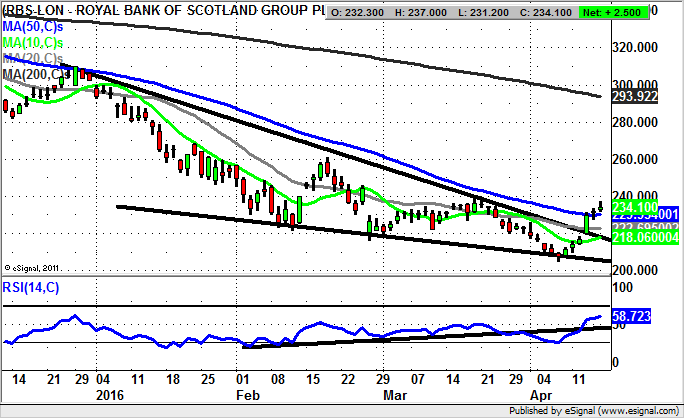
Considering that the banking sector has been so unloved until the past week, it seems worthwhile looking to the daily chart of RBS as an update at this time. This is because we were anticipating a possible breakout of a falling wedge bullish configuration, which can be drawn from as long ago as the beginning of the year. Indeed, the resistance line of the formation ran at 220p and we have a decent progress over the past couple of sessions from that breakout. The best that can be said now is that at least while there is no end of day close back below that line, shares of RBS could head towards post February resistance above 250p, with the latest clearance of the 50 day moving average at 229p on a weekly close basis certainly providing extra confidence. The timeframe on the upside scenario could be as soon as the next 2 to 3 weeks.
Small Caps Focus
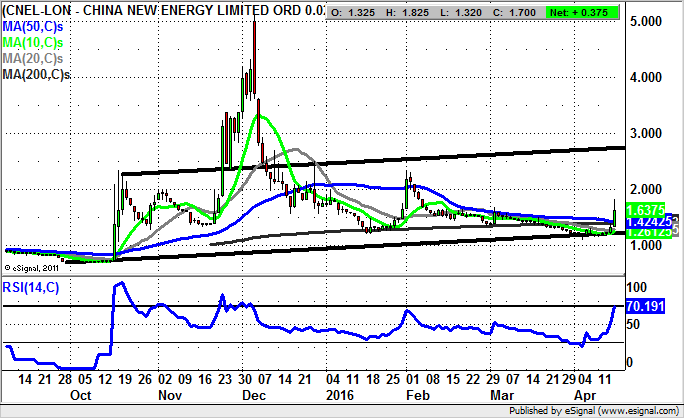
China New Energy (CNEL): Above 50 Day Line Targets 2.75p
Although it is the case that one shudders, at least initially, at the prospect of backing a stock with the word China in its name, considering this is a technical exercise rather than a fundamental one it may be safe to look at the prospects for China New Energy in terms of the price action only.
What can be seen here currently is the way that there has been a recovery of the 50 day moving average at 1.42p. This has come in the wake of the March/April bear trap rebound from below the 200 day moving average at the same level. The view now is that while there is no end of day close back below the 50 day line we could see a journey towards the top of a rising trend channel from October last year with its resistance line projection pointing as high as 2.75p. This makes for a decent one month target, especially while there is no price action back below the 50 day line.
Mountfield (MOGP): 2014 Triangle Break
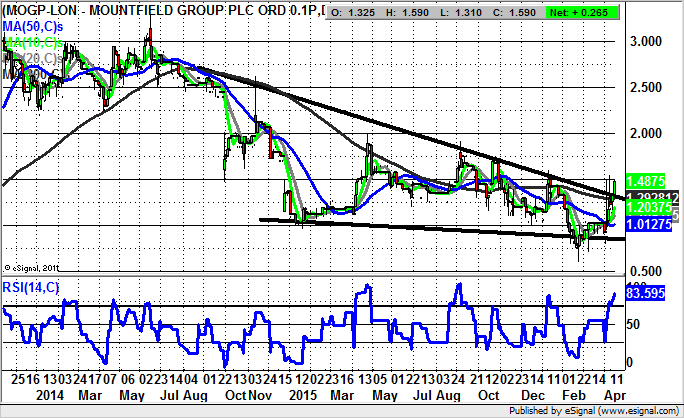
It certainly seems worthwhile taking a look at the latest charting configuration at Mountfield given that we are trading in the aftermath of a weekly close above both the 200 day moving average of 1.29p and the top of a triangle formation which has been in place since the middle of 2014. The likelihood here is that provided there is no break back below the 200 day line, one would be expecting a follow-on move to the upside back up to the main 2015 resistance at 2p plus. The time frame on such a move is regarded as being the next month.
Rose Petroleum (ROSE): 2015 Price Channel Target
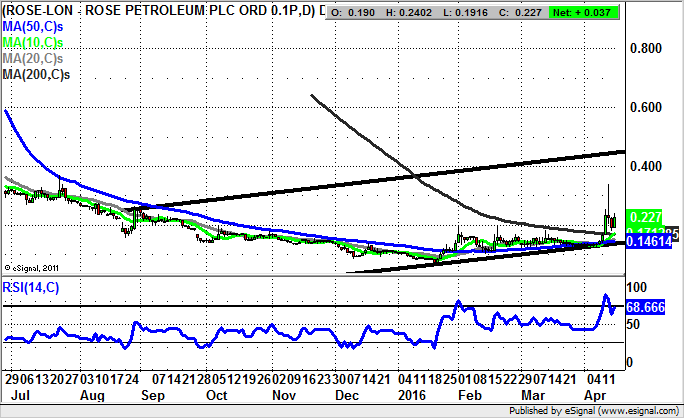
In many ways the decline and subsequent recovery on the daily chart of Rose Petroleum has been a textbook example of price action in both directions. This is because after a bruising bear run we saw the shares finally recover the 50 day moving average, then at 0.12p, at the end of January. Since then there has been a consolidation at and above this feature, also coinciding with the bottom of a rising trend channel which can be drawn from as long ago as August last year.
For the near term the best development here has been the recovery of the 200 day moving average at 0.17p, and the way that the price action then has settled into a very encouraging looking Bull flag. This allows us to suggest that while there is no end of day close back below the 20 day line we should see Rose Petroleum have as high as 0.45p over the next month, at the top of last year’s trend channel.
Comments (0)