Zak’s Daily Round-Up: IAG, INTU, INF, FPM, GRPH and ITM

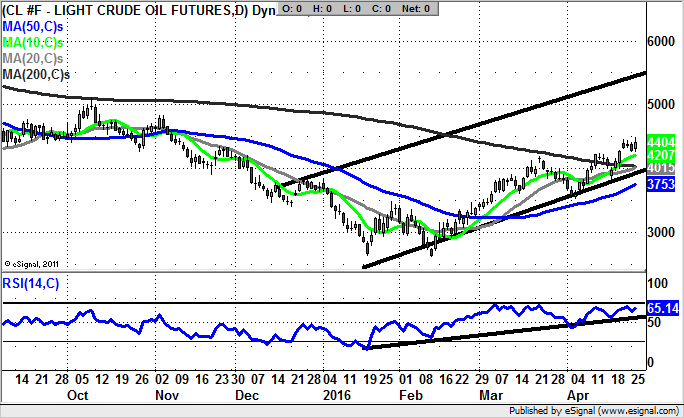
Market Direction: Crude Oil above $42 Suggests as High as $55
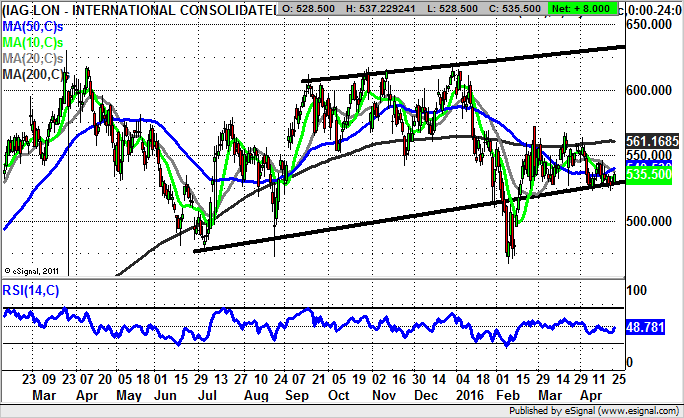
International Consolidated Airlines (IAG): Above 50 Day Line Targets 570p
The usual message in charting is that the worse the trap, the bigger the subsequent move in the opposite direction. This is what we expect to see at International Consolidated Airlines, where there has been a rising trend channel which can be drawn in from as long ago as July last year. The floor of the channel currently runs at 530p, something which suggests that only a weekly close back below this number is likely to be enough to break the back of the latest recovery. That said, given the vicious, narrow February bear trap rebound from the former August 472p low of last summer, the momentum in terms of the price action is regarded as being very much in favour of the longs. The idea now is that as little as an end of day close back above the 50 day moving average at 541p should be enough to take the shares back up to the main post February resistance zone above 570p – also just above the 200 day moving average at 561p during May. But it may still very well be that cautious traders would look to a weekly close above the 200 day line before anticipating a full blooded push to initial 610p plus resistance for 2016.
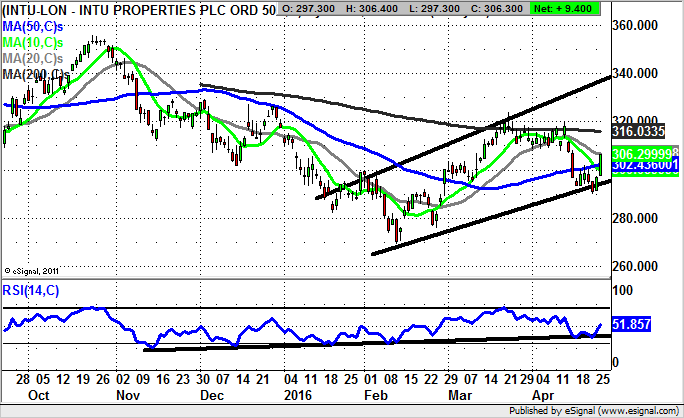
Intu Properties (INTU): January Price Channel Targets 340p
Intu Properties may not strike one as being a key technical play contender amongst FTSE 100 stocks, but what can be seen here on the daily chart is the way that there has been a very solid set of technical signals since the lows were made in February. Indeed, the turnaround of that month was a very healthy W shaped reversal which built on the initial February gap top at 276p. The gap fill rebound later that month is still dominating the charting picture, with progress seen within a rising trend channel which can be drawn in from as long ago as the end of January. The floor of the channel currently runs at 298p – level with the 10 day moving average. This implies that while there is no end of day close back below the 10 day line we could be treated to significant further upside. The favoured destination at this point is regarded as being the top of the 2016 price channel with its resistance line projection running up to 340p. The timeframe on such a move should be as soon as the end of next month.
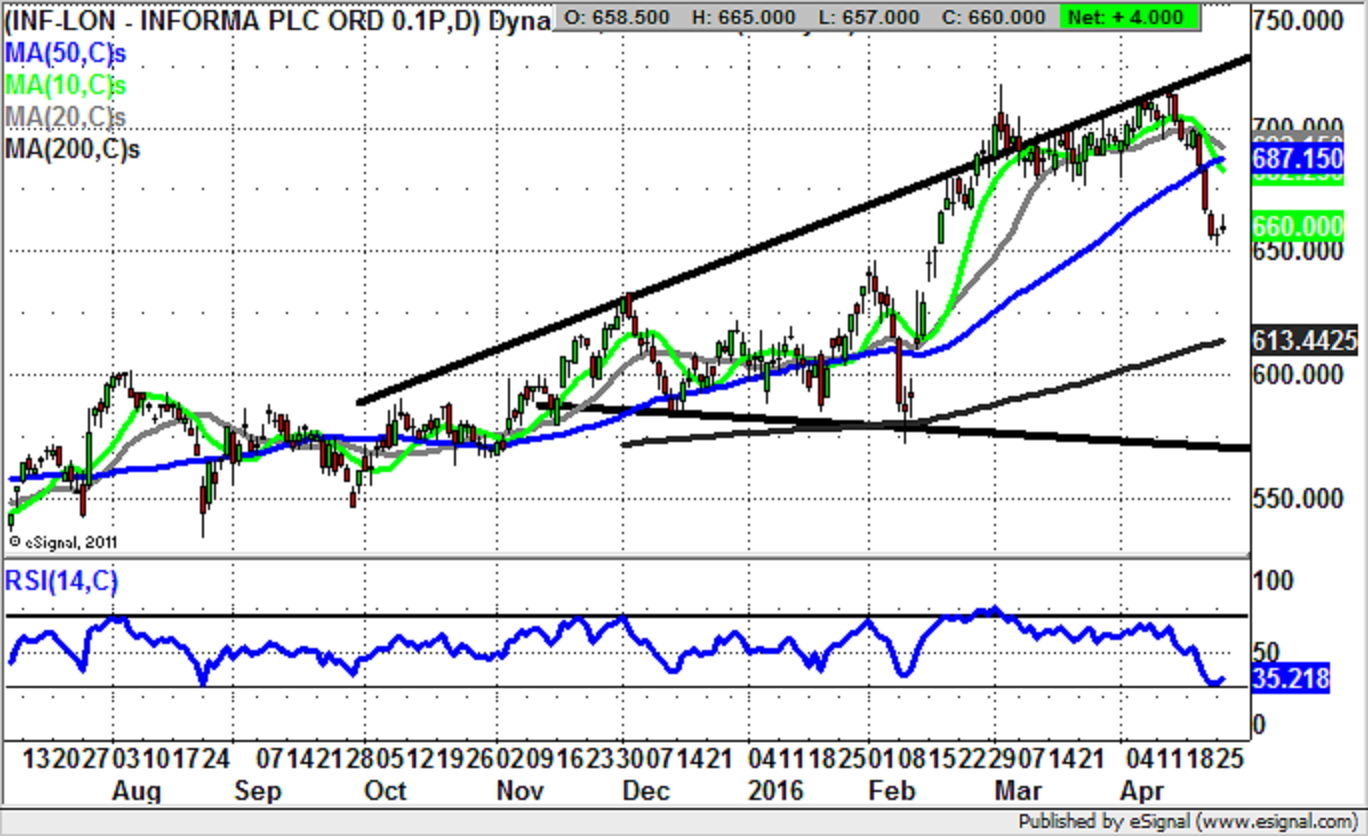
Informa (INF): Support towards 650p
Informa shares do, on the face of it, offer bulls of the stock a very encouraging picture which has been in place since early February and the main stock market turnaround. This is said on the basis that the bear trap rebound from a couple of months back from below the 200 day moving average, at 613p currently, but then below 570p. The view now is that the shares could bounce at and around the former early February resistance just below 650p. But at least while above this area the hope would be that we shall be treated to a partial, or even full retest of the best levels of the year to date at 710p plus. The timeframe on such a move is regarded as being the next 4-6 weeks.
Small Caps
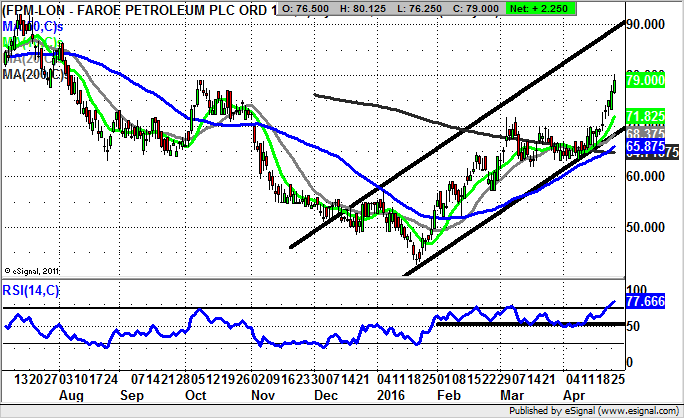
Faroe Petroleum (FPM): December Price Channel Target
It is certainly interesting that as far as the daily chart progression for Faroe Petroleum it was third time lucky in terms of clearing the 200 day moving average, now at 64.67p. The idea now as far as the near-term price action here is that we shall see an acceleration towards the top of a rising trend channel which can be drawn in from as long ago as December. While the recent gains have left the stock very overbought with a RSI reading of 80 plus, at least while there is no end of day close back below the 10 day moving average at 73.2p one would be looking for further decent upside. The favoured destination is as high as the five month resistance line projection, currently pointing at 92p, a level which could be hit as soon as the next 2-4 weeks.
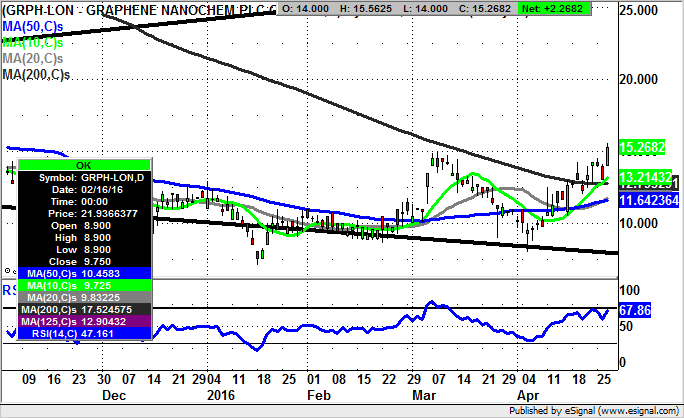
Graphene Nanochem (GRPH): Broadening Triangle Targets 27p
Although it is clear from the daily chart of Graphene Nanochem that this is not exactly an easy stock to get a technical handle on, we have been treated to a relatively clear cut charting signal which should inspire confidence. This consists of a clearance of the 200 day moving average at 12.79p, with the message at the moment being that provided there is no weekly close back below this feature, one would be looking to further significant upside. Just how high this could stretch is suggested by the top of a broadening triangle in place since as long ago as the early part of July. The resistance line projection of the triangle is currently pointing to the 27p level, an area which could be hit as soon as the next 1-2 months.
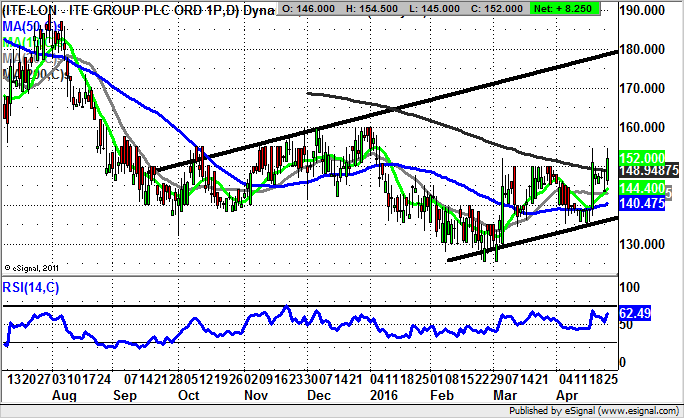
ITM Power (ITM): Key Resistance Line
The good thing about technical analysis is that, if nothing else, one has “lines in the sand” in terms of boundaries for the bulls and bears. In the case of ITM Power it can be seen how the shares have so far failed at a line of resistance at 17.4p, leaving this to be cleared ahead of an official technical trend change. That said, while there is no end of day close back below the 50 day moving average at 13.16p aggressive traders would certainly wish to remain long in anticipation of a lasting break to the upside and a notional 21.03p 200 day moving average target. Otherwise the momentum trade here is to wait on an end of day close above the October resistance line before taking the technical plunge on the upside, just in case the post September breakdown here still has a sting in its tail.
Comments (0)