Zak’s Daily Round-Up: CPI, CRH, SSe, BMR and CTAG

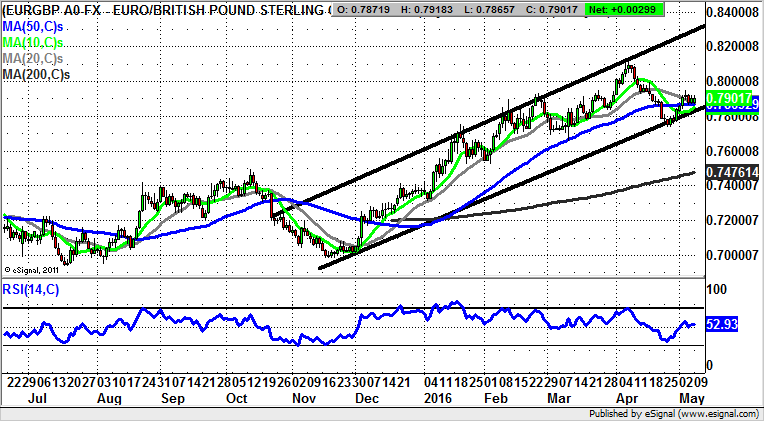
Market Direction: Euro/Sterling above 78p Points to 83p
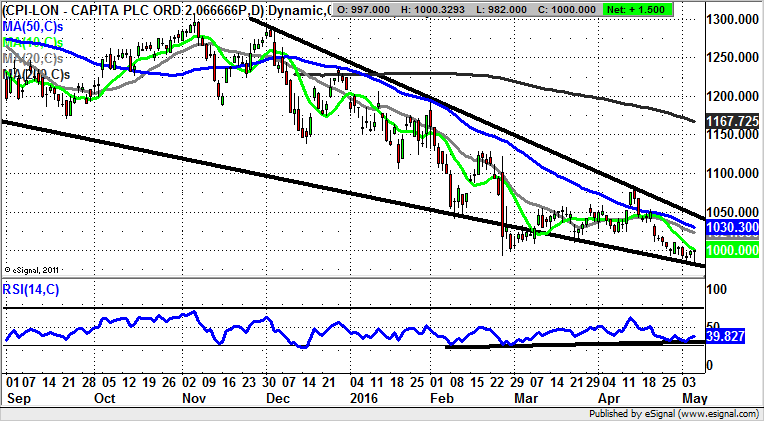
Capita (CPI): Bullish Falling Wedge
Capita can be quite fairly described as a second line FTSE 100 stock, but this does not mean it cannot be enjoyed as a decent charting/technical trading prospect. The present position on the daily chart underlines this idea given the way that we see the stock trading within what looks like a bullish falling wedge pattern which could deliver an extended rebound over the next few months. But what can be said over the near term is that we are focused on a December resistance line projection running just below the 1,050p level, and just above the 50 day moving average at 1,030p. The 50 day line looks to be the near-term target here – over the next couple of week, with a weekly close back above this feature then likely to unwrap the extended move to the upside the bulls have been waiting on for quite some time. Just what the next zone for the shares would be on a break of the wedge could be is suggested by the area of January support at 1,105p and former February 1,128p resistance. Such an area is expected to be hit as soon as the end of next month, if we get a relatively quick clearance of the 50 day line. At this stage only well below 987p intraday low of May so far – say sub 970p would really suggest that Capita shares are set to continue their post autumn 2015 decline.
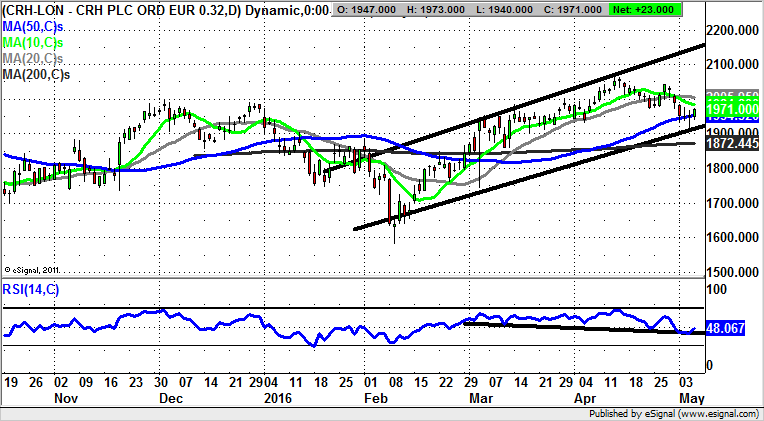
CRH (CRH): Golden Cross Aftermath Targets 2,170p
What can be seen on the daily chart of CRH is the way that since the start of the year we have been treated to a V shaped reversal in which the turning point was a deep bear trap rebound from below last August’s 1,651p floor, and below 1,600p at worst. Since then it has been a story of a rather volatile recovery which can be placed within a rising trend channel that can be drawn in from as long ago as the end of January. The floor of the channel currently runs at 1,940p, level with the intraday low of May to date. All of this goes to suggest that especially while there is no end of day close back below 1,940p we could be treated to a fresh leg to the upside, within the 2016 price channel. The resistance line of the channel is currently pointing as high as 2,170p, and this is the assumed target to be hit over the next couple of months. Indeed, one would be confident of the recovery progressing, as long as the 200 day moving average, now at 1,872p, remains unbroken.
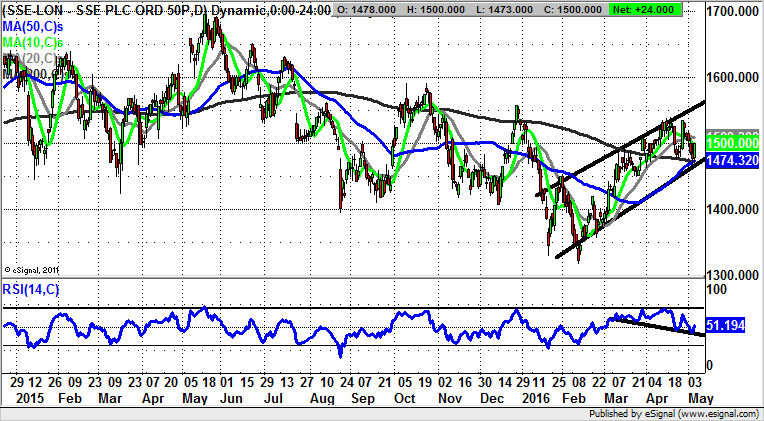
SSE (SSE): Back to Range Highs in 1,550p Zone
It is interesting, considering the way that SSE is a utilities company and should be defensive, that the decline here at the beginning of the year was fully in line with the rest of the market. This underlines the way that when under pressure, investors have a tendency to throw babies out with the bathwater as far as their holdings are concerned. But what can be seen since the early February bear trap rebound from below the former January 1,329p floor is that there has been a relatively consistent rebound within a rising trend channel which can be drawn from as long ago as the end of January. The big plus to end last week, apart from an RSI rebound off a line of support in the RSI window off the 50 level, is the way that there has been a bounce off both the 50 day and 200 day moving averages at 1,474p. This leads us to believe that at least while there is no end of day close back below the moving averages and the 2016 uptrend line, we should anticipate a “minimum” upside at the top of this year’s price channel at 1,550p. The time frame on such a move is seen as being the next 2-4 weeks. Above this level the resistance zone of 1,700p plus is regarded as being the next target for a 2-3 month view.
Small Caps
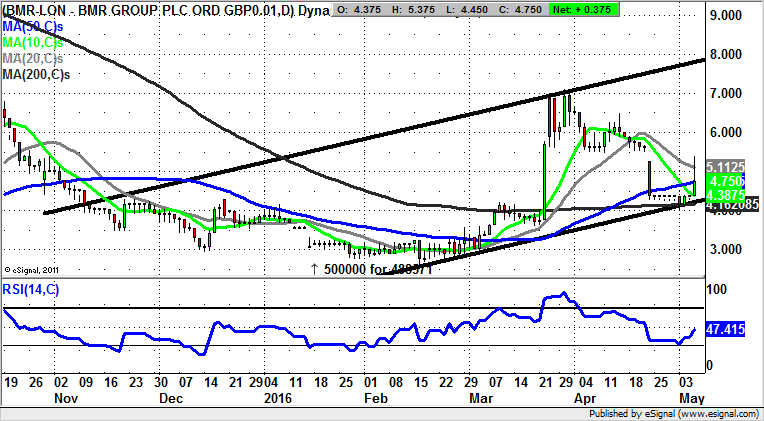
BMR Group (BMR): November Price Channel Target at 8p
What can be seen on the daily chart of BMR Group is the way that there has been a decent basing process in place here over the post November period. But the big breakthrough was back in March, with the stock delivering a near vertical move through the 200 day moving average at 4.16p. While this was something of a flash in the pan move, the way that the shares have since come back to test the 200 day line as new support suggests that we may be correct to anticipate a fresh leg to the upside. On this basis one would look to an end of day close back above the 20 day moving average at 5.11p as the momentum buy trigger for a return to the 8p price channel top zone.
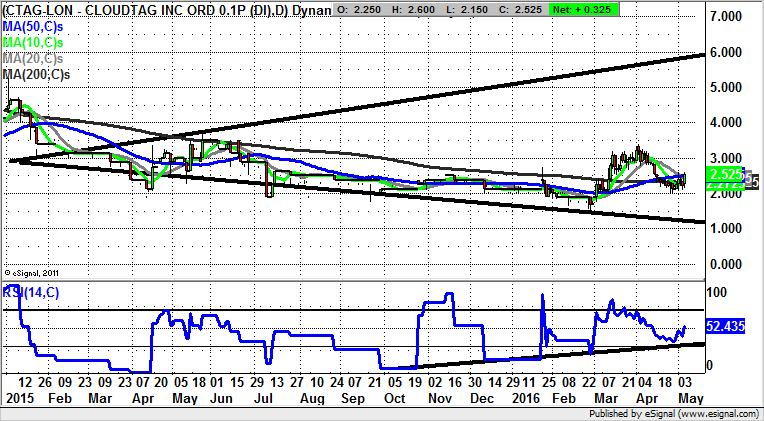
Cloudtag (CTAG): November Price Channel Targets 3.75p
The clue to the potential bullishness of shares of Cloudtag was the gap to the upside at the end of March, very often the precursor to an extended bullish move. The present situation is that we have been treated to a post mid-April bear trap rebound from below the 200 day moving average now at 2.32p. The assumption to make now, especially given the clearance of the rising 50 day moving average at 2.52p, is to assume there will be further progress within a rising trend channel in place from the autumn since 3.7p. The timeframe on such a move is regarded as being the next 1-2 months. At this stage any weakness towards the 200 day line is regarded as a buying opportunity, even though we have just seen a fresh RSI buy signal in the form of the clearance of the neutral 50 level to leave it at 52.4/100.
Comments (0)