Zak’s Daily Round-Up: BP., STAN, VOD, BOD and SAR

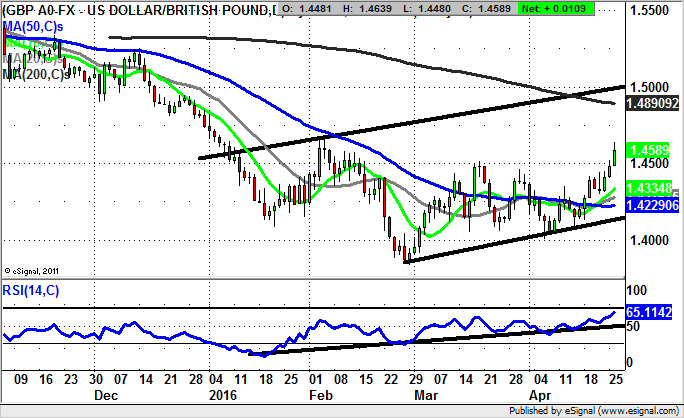
Market Direction: Pound/Dollar above $1.45 Could Stretch to $1.50
BP (BP.): Above 200 Day Line Targets 410p
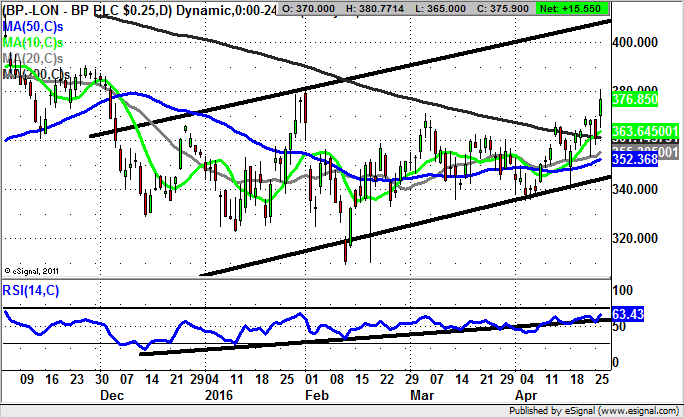
Although it would be pleasant to suggest that Bob Dudley should be paid the multi millions in salary he had been wanting, if nothing else it is clear that in the wake of the Deepwater disaster and the damage to the balance sheet, a little belt-tightening should have been demonstrated. When you add in the plunge in Crude Oil prices, there seems to be little rationale in splashing the cash in the boardroom. But perhaps the charting position is a little more equivocal? What can be seen here over the past few months is the way that there has undoubtedly been an extended basing, with the highlights in this respect being the double bottom for the stock in February below 320p, followed by the two gaps through the 200 day moving average at 362p. The message now with the latest push through the 200 day line and through the initial April resistance at 367p is that we appear to be looking at a genuine trend change. Therefore the expectation is that at least while there is no end of day close back below the 200 day line, one would anticipate a target as high as the top of a rising trend channel from December at 410p over the next 4-6 weeks. The added bonus of all of this is the way that such a move would most likely add a decent amount to the level of the FTSE 100, given the relatively heavy weighting of this stock in the index.
Standard Chartered (STAN): October Gap Target
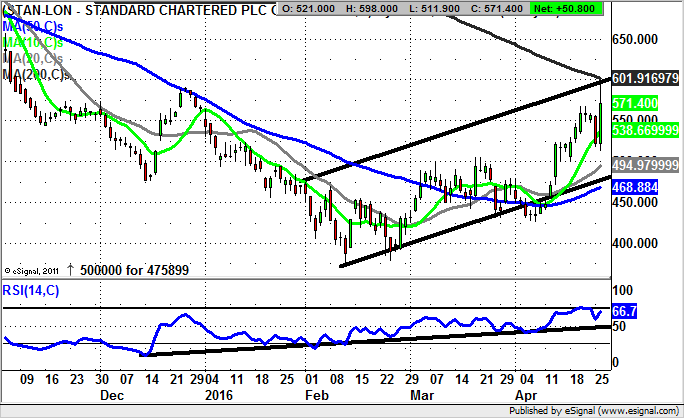
It would be churlish not to look at the daily chart of Standard Chartered given the latest rebound we have seen. This is because for a long time the stock looked as though it was in some kind of terminal decline. Of course, the near miraculous stabilisation we have been treated to for the Chinese stock market has fed through to companies with business in the Far East, and even Standard Chartered is no exception. Indeed, today witnessed a key reversal to the upside off the 10 day moving average at 538p. The 10 day line is now the feature to buy down to as we chase an initial target of the 200 day moving average at 601p. If this can be cleared at the end of this week, one would be looking to a top of October gap down target as high as 666p by the end of next month.
Vodafone (VOD): Consolidation above 200 Day Moving Average
One of the somewhat less fortunate issues regarding the price action of Vodafone is the way that the shares are deceptively difficult to get a handle on, even in the best of times. This is of course a feature of many leading international FTSE 100 plays, given the way they are not only moved around off the back of company specific news, but also as a reaction to macro economic factors. Of course, just in case you have an ability to withstand all of this, the odd broker upgrade and downgrade can be added to the mix as well.
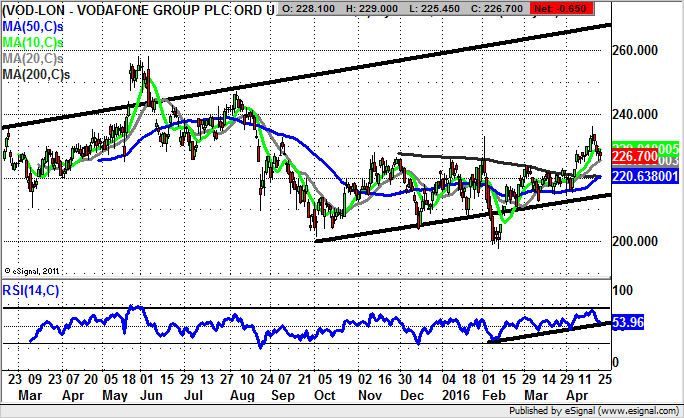
Returning to the technical picture here, and it can be seen how it is possible to draw a rising trend channel in place on the daily chart since as long ago as the beginning of last year. However, it has to be admitted that even though the stock has been relatively loyal to the floor of the channel, it is difficult to be that convinced the notional upside of 265p may be on its way anytime soon. This is even though the shares based out in February with a bear trap gap reversal from below 200p.
What will be key over the next week or so is whether the shares can sustain the area of the 50 day and 200 day moving averages, currently crossing at the 220p level. If there is no relapse below this notional support zone one would be looking to a retest of last year’s resistance in the upper 250p’s over the next 1-2 months. The other strategy would be to wait for a break back above the 10 day moving average, now at 228.9p, as a momentum buy trigger before taking the plunge on the upside. An extended uptrend line from February near the neutral RSI 50 level should ideally not be broken ahead of any 10 day line clearance.
Small Caps Focus
Botswana Diamonds (BOD): Big Picture Target at 4p
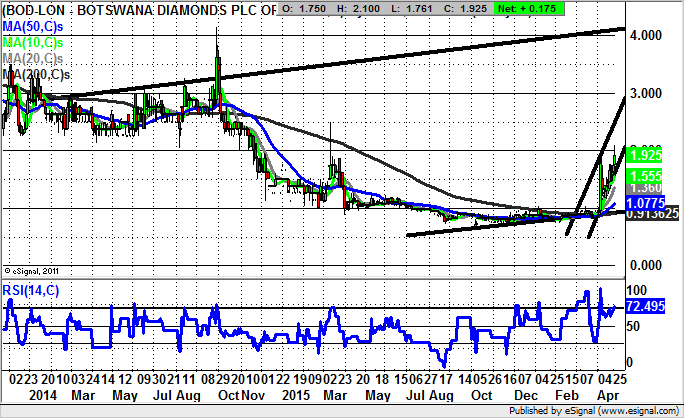
What can be seen on the daily chart of Botswana Diamonds is the way that over the recent past we have been treated to one of the more positive charting patterns, the V shaped bull flag. This has been in place for much of April to date. Indeed, the top of a March rising trend channel at 2.75p looks to be the two week timeframe technical target on any swift end of day close above the initial April intraday peak of 2p. This is especially valid while there is no break back below the 10 day moving average at 1.56p – the trailing stop loss. As for the bigger picture target here, a return towards the top of a rising trend channel from the beginning of 2014 around 4p could be possible over the next 1-2 months, provided the 1.5p zone remains in place as support over the next couple of weeks.
Sareum (SAR): 1.4p 2016 Price Channel Target
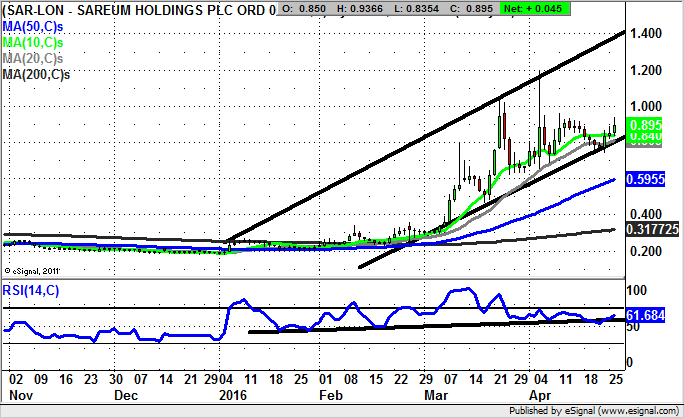
Sareum has been one of 2016’s big charting winners, and it would appear that there is still more gas in the tank if the technical picture here is to be believed. This is said in the wake of recent progress within a rising trend channel which has been in place since the beginning of the year. The floor of the channel runs level with the 20 day moving average at 0.8p, and at least while above the latest 0.73p support one would call this stock up to the 1.4p 2016 resistance line projection over the next 1-2 months.
Comments (0)