Zak’s Daily Round-Up: BA., DLG, NXT, AVON, FBT and PROX

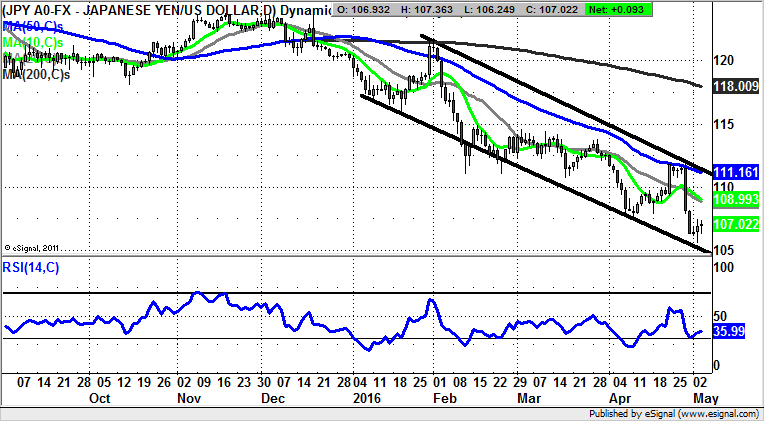
Market Direction: Dollar / Yen Initial Support towards 105
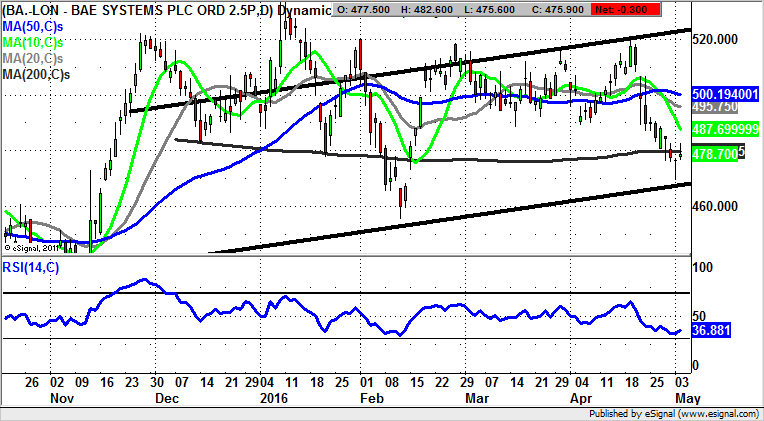
BAE Systems (BA.): A Trump Play?
Of course, one of the keys of trading or investing in a technical way, or even otherwise, is to be aware of the ranges a stock or market may have. This is very much what we have in mind at the moment as far as BAE Systems is concerned, with the interest being provided by the way that Tuesday’s price action was a hammer candle off the floor of the range and a rising trend channel from October – it was also a failed gap fill buy signal. This is because the bottom of the February gap was at 468p and the low yesterday at 469p, before the stock revived. All of this is has to be regarded as very positive, even though overall stock market conditions appear rather flat. Ironically, the almost certain nomination of Donald Trump as the Republican candidate for President of the United States could mean there is plenty of new business for defence contractors like BAE Systems. Therefore, perhaps the best way forward here is to either buy any dips towards the 470p mark, or look to a momentum signal such as an end of day close back above the 200 day moving average at 479.75p. This is not too far away, but at least it would suggest that the bulls are properly back on track. The upside above the 200 day line is seen as being as high as the post February range at 520p, 1-2 months after such a moving average trigger.
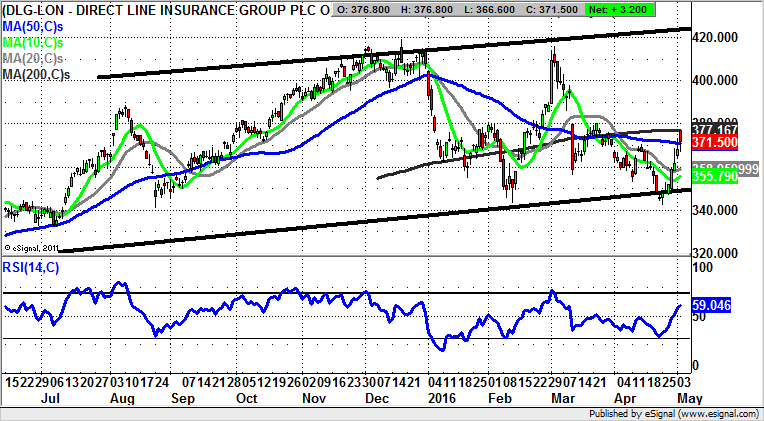
Direct Line Insurance (DLG): Range Highs towards 420p
Another stock and another range play for Direct Line Insurance, with the levels in question coming in the form of the floor towards 340p and the ceiling since the autumn up to 420p. Indeed, the latter number is what we are looking for, although once a certain trigger or two is activated. The favoured technical one in this respect would be the most obvious: an end of day close above the 200 day moving average at 377p. That said, the RSI has already cleared the neutral 50 level to leave it at 59, something which would suggest that aggressive traders are already very much on board. As far as the money management position is concerned, one would suggest that either back below RSI 50 or the 20 day moving average at 358p could be enough of a signal to imply we should exit longs or stand aside for the near term.
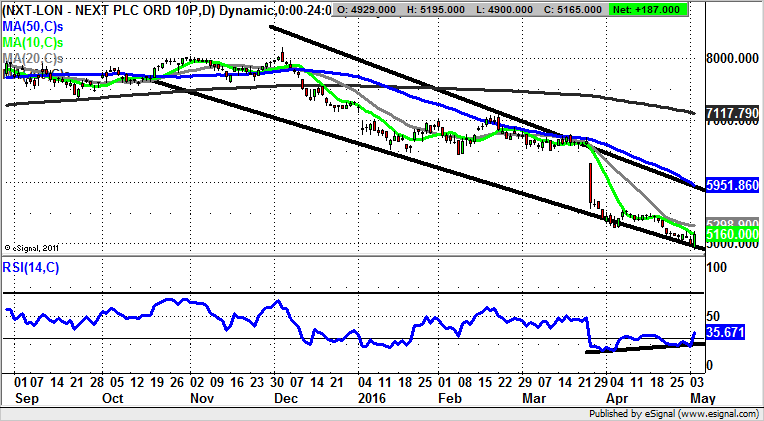
Next (NXT): Bullish Divergence from 5,000p
We have something of a conundrum at Next, both in terms of the fundamentals and the relationship with this and the price action, as well as on a charting front in its own right. This is said in the wake of the latest warning from the fashion retailer, as well as the rebound off the floor of a potentially bullish falling wedge pattern towards the 5,000p level. When you add in the way that the shares have turned around from the big, round number, accompanied by positive divergence in the RSI window, this could be a move that has legs. The favoured destination at this point is for a push to the April resistance zone at 5,500p plus over the next 2-4 weeks, even if the breakdown from the end of last year continues after that.
Small Caps
Avon Rubber (AVON): Trendline Break Targets 200 Day Moving Average
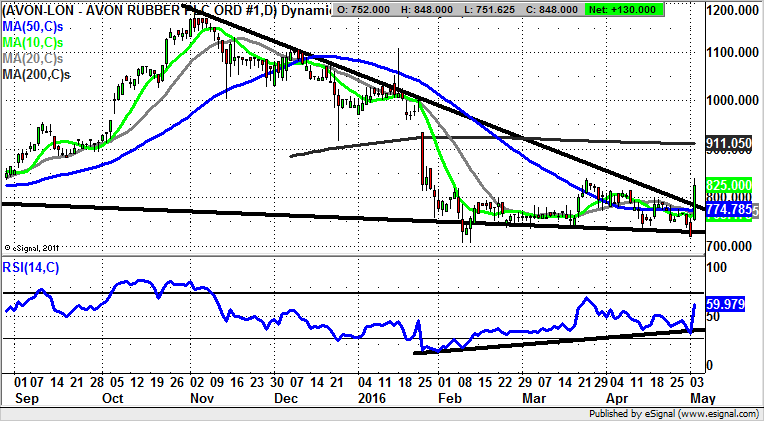
It can be said without too much fear of contradiction that Avon Rubber has not exactly offered its shareholders a pleasant ride over the recent past. This point is mainly witnessed by the way that there was a massive gap to the downside through the 200 day moving average, currently at 911p, at the end of January. Following this though, there was an extended base made, which was accompanied by a rising trend line in the RSI window – one which suggests bullish divergence, and a possible extended turnaround. The position now is that we have been treated to a charting breakthrough, coming in the form of a clearance of the 50 day moving average at 774p / a November resistance line. The implication now is that at least while there is no end of day close back below the 50 day line we could be treated to a retest of the 200 day moving average. The timeframe on such a move is regarded as being as soon as the end of this month.
Forbidden Technologies (FBT): Gap through 200 Day Line Targets 14p
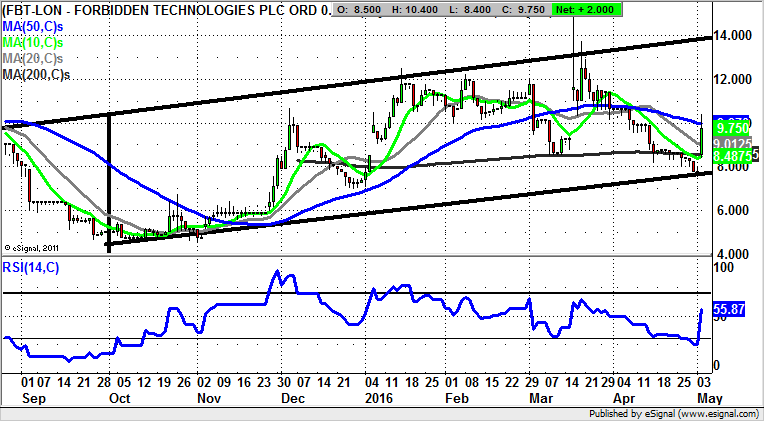
On the face of it some traders may conclude that Forbidden Technologies is perhaps not the finest charting choice they could make, given the rather rocky ride we have seen here over the recent past. This is particularly the case considering the bull trap following a gap to the upside seen in March, and the latest bear trap gap reversal from below the 200 day moving average at 8.49p / the initial April support under 8p. The position now is that we are looking at a quite robust looking recovery, helped along by the way that the stock has seen its RSI head back above the neutral 50 level to stand at 56. On this basis aggressive traders would be going long of the shares assured by the RSI move, otherwise an end of day close back above the 50 day moving average at 9.97p is the technical trigger to chase. A clearance of the 50 day line suggests that a September price channel top destination as high as 14p could be on its way over the next 1-2 months. The stop loss on the buy argument is regarded as being an end of day close back below 8p.
Proxama (PROX): December Price Channel Target at 2.5p
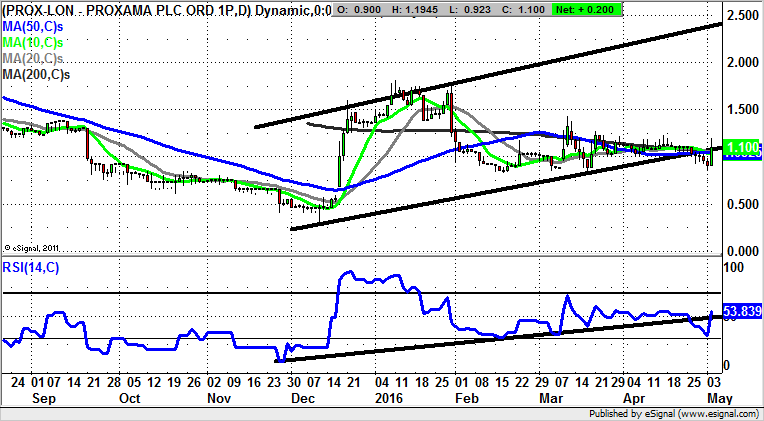
One of my favourite charting signals is the gap through the 50 day moving average for a stock or a market – after an extended bear move. This was seen on the daily chart of Proxama back in December, with the period since then witnessing consolidation. The position now is that it would appear that the consolidation has finished and we shall see a fresh leg to the upside. An end of day close above April resistance at 1.25p should be the starting gun on a top of December price channel move to 2.5p over the next 1-2 months.
Comments (0)