Zak’s Daily Round-Up: ARM, ITV, TSCO, KEFI and OXP

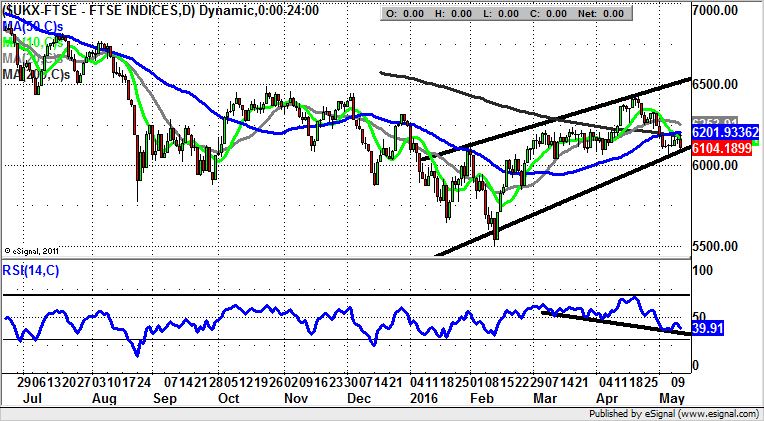
Market Direction: FTSE 100 Key Support Line at 6,080
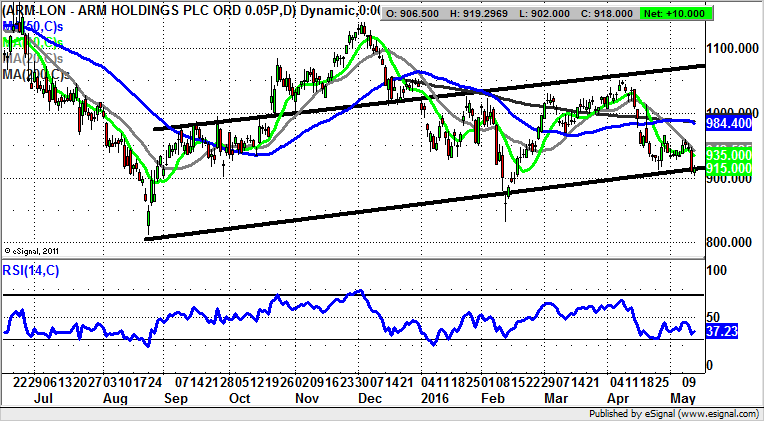
ARM (ARM): Initial April Bear Trap
ARM Holdings certainly has been something of a standard bearer for the UK tech sector over recent years, especially given the issues its smaller cousin Imagination Technologies has been suffering of late. The present position on the daily chart of ARM reflects how there has been something of a negative read across from customer Apple (NASDAQ:AAPL). The question now is whether there has been enough of a retracement to make it worthwhile bottom fishing the range floor? As things stand it would appear that there is an August uptrend line to buy against at current levels. This is especially so given the 912p April floor being temporarily breached this month. The ideal scenario given the way that there has been an initial rebound back above this level today, against a backdrop of bullish divergence in the RSI window versus the May trap, is that we are treated to a weekly close today above 912p. If this is the case then one would be reasonably confident that there could be at least an intermediate rebound back towards post late April resistance at 960p over the next 2-3 weeks. The stop loss would be in place from 890p and below.
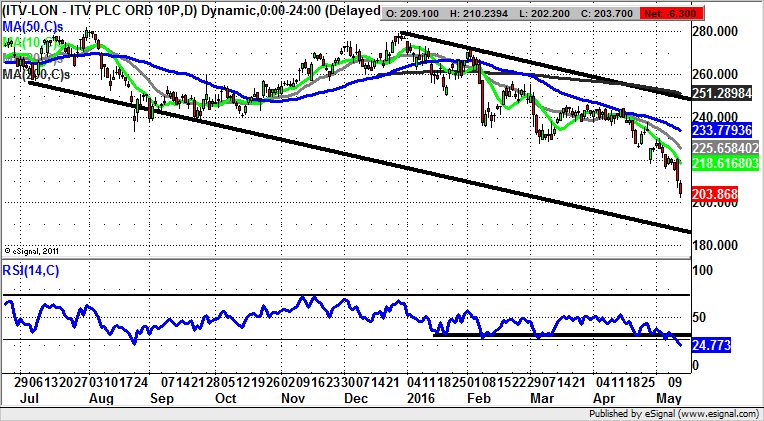
ITV (ITV): Downside Overshoot?
It would appear that the technical position of ITV has gone from bad to worse over the past month. This is made even more painful given the way that most traders would have almost certainly have been in bottom fishing mode, and going against a falling knife. In such circumstances it pays for those investigating such situations to get a tight and realistic grip on where support might finally come in. As far as what can be gathered at the moment, the favoured destination could be as low as 185p, and the floor of a falling trend channel from July. This target is valid as soon as the next 4-6 weeks, even though the shares are currently very oversold at RSI 24. Indeed, any rebound towards the 10 day moving average at 218p can be regarded as a sell opportunity to improve the risk/reward of going short. Only a weekly close well above 220p would really delay the downside scenario.
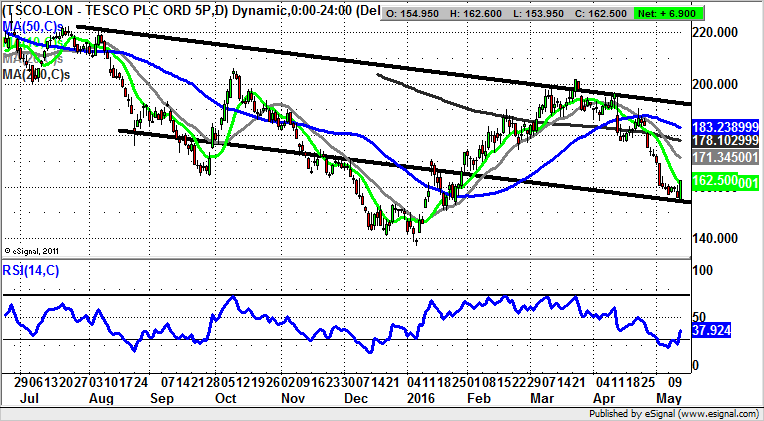
Tesco (TSCO): Support above January Gap
Congratulations to the CEO of Tesco, Dave “Drastic” Lewis, whose tough job this year is set to be upgraded in terms of payout with a near £5m haul. While he may make it look easy, I would venture to suggest that anyone could have copied the “recovery” strategy of just selling off businesses and capacity? But away from the sour grapes. Looking at the daily chart of the UK’s leading grocer and it can be seen how there has been a rather painful, but not too surprising, breakdown over the past month, with the bulk of the pain being delivered in the wake of the gap down through the 200 day moving average now at 178p. Indeed, it can be seen how all the near-term moving averages are currently falling – not normally a good sign. The light at the end of the tunnel so far though, may be the way that today has witnessed quite a sharp looking key reversal to the upside, off the floor of a falling trend channel which can be drawn in from as long ago as August last year. Adding to this plus point is the way that the rebound has come in above the floor of the second January gap to the upside at 148p. The conclusion to draw is that even though we may only see an intermediate rally up to the area of the 20 day moving average at 171p, support holding above the second January gap could mean that this stock is still one which we should regard as being in a range, rather than necessarily a bear market.
Small Caps
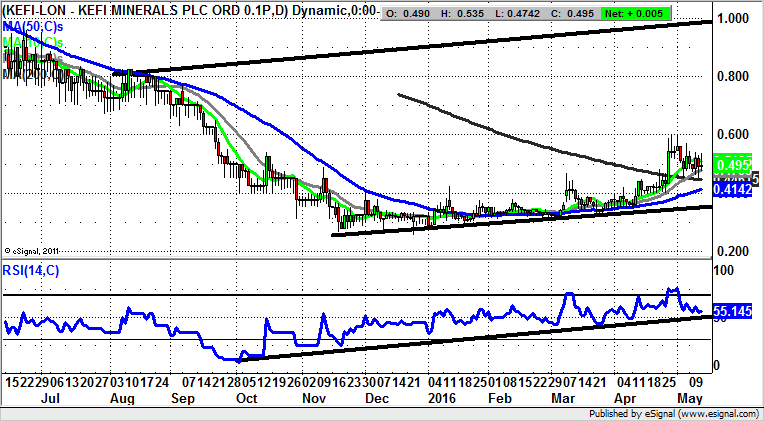
Kefi Minerals (KEFI): Extended Base Targets 1p
Kefi Minerals has been and remains something of a private investor favourite, with this being the case even before the great mining sector turnaround of 2016. The charting reason for suggesting this stems from the way that there was an extended base already forming in the autumn, at and around the 0.3p zone. But the big technical breakthrough of the recent past has been the conquering of the 200 day moving average now at 0.44p at the end of last month. Since then we have been treated to a double intraday test off this still falling feature, and note how 200 day line breaks are regarded as being all the more robust when the price action overwhelms a falling line. As far as what may happen next is concerned we take the view that provided there is no end of day close back below the 200 day line there should be an acceleration to the upside, with the initial target the top of the post April bull flag at 0.6p. That said, it would be perfectly understandable if some cautious traders chose to wait on a daily, or even a weekly close above the 0.6p level, before taking the plunge on the upside. The target above 0.60p is currently regarded as being as great as the top of a rising trend channel from August last year at 1p. The timeframe on such a move should be as soon as the next 1-2 months.
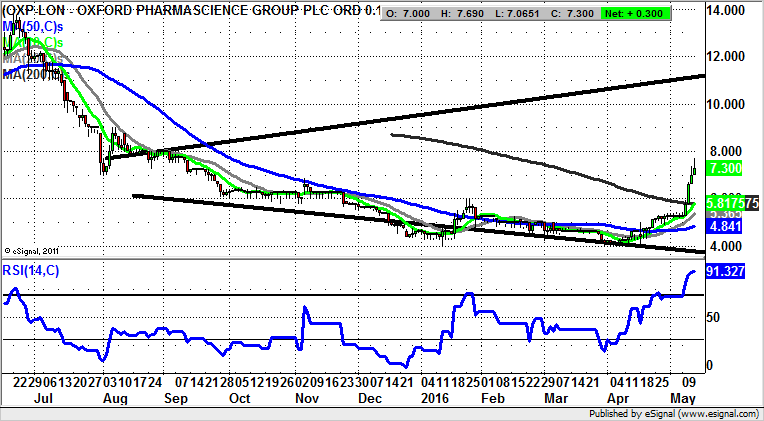
Oxford Pharmascience (OXP): 11p 2015 Triangle Target
It is worth recapping on the technical position of Oxford Pharmascience given the acceleration we have seen in the wake of the clearance of the 200 day moving average at 5.8p. The hope now is that the stock will retrace now lower than the former November peak at 6.84p on an end of day close basis, with the 1-2 months target at 11p and the 2015 price channel top. The stop loss on the recovery argument is the 200 day line.
Comments (0)