Zak is Back!

BHP Billiton (BLT): possible wedge reversal to 700p zone
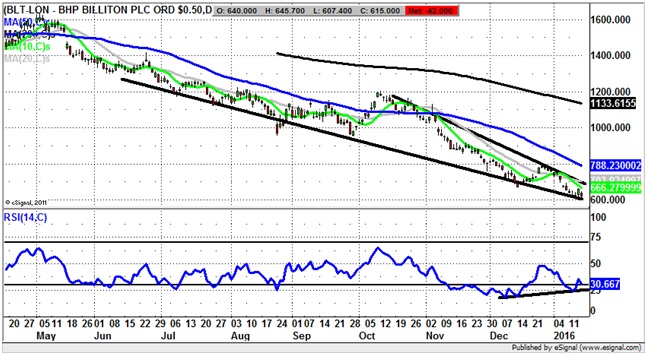
While looking for a floor in shares of BHP Billiton has been neither a wise nor a fruitful exercise in the recent past, it may be that after the latest writedown and the fresh lows on the FTSE 100 we have a bona fide bargain hunting opportunity. This is said despite the way that the smart money would probably be happiest simply waiting for a higher low and higher high on the daily chart before even beginning to think of pressing the buy button. The reason for not waiting for fresh evidence of recovery would be that we have higher RSI readings for January versus December, even though the stock has fallen lower than last month. There is also the hint that we are looking at a falling wedge – bullish – reversal as far as the post October chart pattern. This would suggest aggressive traders could go long of the shares with a stop loss just below the January support to date at 607p. Ideally, the shares would at least rebound back to the top of the wedge / October resistance line / 20 day moving at 703p as a dead cat bounce, even if the ongoing breakdown for the stock over the past couple of years and more continues after that.
Shire Pharma (SHP): initial bear trap rebound towards 4,700p
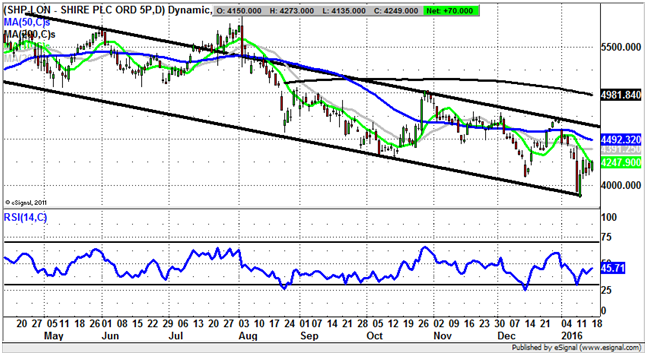
Shire Pharma has been a particular favourite of mine on a fundamental perspective over the recent past, despite the way it is sometimes difficult to understand the merits of its development of treatments of obscure diseases, and despite its recent (perhaps somewhat desperate) strategy of being on the acquisition trail in the biotech space even though it runs the risk of paying bubble prices. Of course, the reason for the M&A enthusiasm here is to avoid the danger of being acquired itself. From a charting perspective it can be seen on the daily timeframe that we are looking at a stock which has certainly been on the back foot since last year’s quintuple bull trap top, and subsequent unfilled gap to the downside back below the 200 day moving average currently falling at 4,986p. While it has to be acknowledged that there is the risk of a full retest of support at former October 2014 support below 3,500p, at least in the near term we are indicated to be on the receiving end of an intermediate rally. This is said on the basis of the early January recovery of former December support at 4,082p. The bear trap rebound accompanied by bullish divergence in the RSI window goes to suggest that provided there is no end of day close back below the floor of last month, we could at least be on the receiving end of a retest of the main post November resistance at 4,700p plus over the next 1-2 months.
Bull Call
Centamin (CEY)
Centamin has the type of chart and is in the kind of sector where you feel that there is decent upside to come imminently, but somehow it still seems to be just beyond reach. Nevertheless, it can be seen how the overall configuration of the stock does look to be well set, on the basis that one can draw a rising trend channel from as long ago as the end of June. The reason for the relative optimism over the near term is the way that the latest support continues a decent run of higher lows since August, with the January support coming in right on the present positions of the 50 day and 200 day moving averages. Provided there is no end of day close back below the 200 day line, we should be treated to a robust rebound. This is particularly the case given the way that the RSI, now at 56 / 100, has just bounced quite aggressively off the neutral 50 level. Such oscillator signals are invariably leading indicators on strong momentum moves, and given how long the latest recovery at Centamin has been in the making, one would consider that the implied break towards the top of a rising trend channel which can be drawn on the daily chart from as long ago as June should be on the cards. This has its resistance line heading to the 75p level, a destination which could be achieved as soon as the next 4-6 weeks given the present rate of progress.
Bear Call
Ocado (OCDO): technical target as low as 150p
Although it is usually the case that I tend to side with the forces of good rather than evil, and be biased towards long recommendations, occasionally there are very compelling shorts on offer in the market, with the present environment of stock market turmoil suggesting that they are even more shorts around than usual. However, Ocado, to my mind, represents a technical and fundamental sell of exceptional standing. This was both before the latest lunge to the downside for shares as a whole this month, and from the perspective of someone who has been largely of a long stance here historically. Nevertheless, the revelations / rumour that Amazon (AMZN) could be set to muscle in on its space along with the loss of the main post September 309p floor really suggested that this could be a bear position of some quite considerable magnitude. This is particularly so considering the way that the post December 2015 chart pattern has consisted of an extended Head & Shoulders reversal, with its neckline support at 309p broken comprehensively at the end of December. All of this goes to suggest that with no obvious chart support until October 2014’s 216p low, the near term here is grim. But it gets worse. All the near-term moving averages are currently falling, and it is possible to draw a descending price channel from March last year with its support line projection pointing as low as 150p. This makes for a 1-2 month target, especially while there is no end of day close back above the 20 day moving average now at 280p.
Comments (0)