The Not So Obvious: Japan and Switzerland Indices

It’s easy to focus on the same markets all the time and forget to look for opportunities elsewhere. Screening is a useful tool that’s available through most charting packages and online services, but you still may miss some big ones. Nothing beats having an actual browse from time to time. So here are some places that are easy to forget but present some interesting situations.
I think it’s in part because Japan trades while we’re all asleep that we don’t readily think of trading the Nikkei. It’s an unusual market in any case, and you may or may not wish to day trade even if the timing wasn’t so inconvenient. In the ‘80s lunch was for wimps, it seems now it’s for the Japanese. They close the market for an hour. Of course the futures trade 24 hours a day, but in general markets are rarely as good when they’re closed as when they’re open. Certainly that’s the case for intra-day positions.
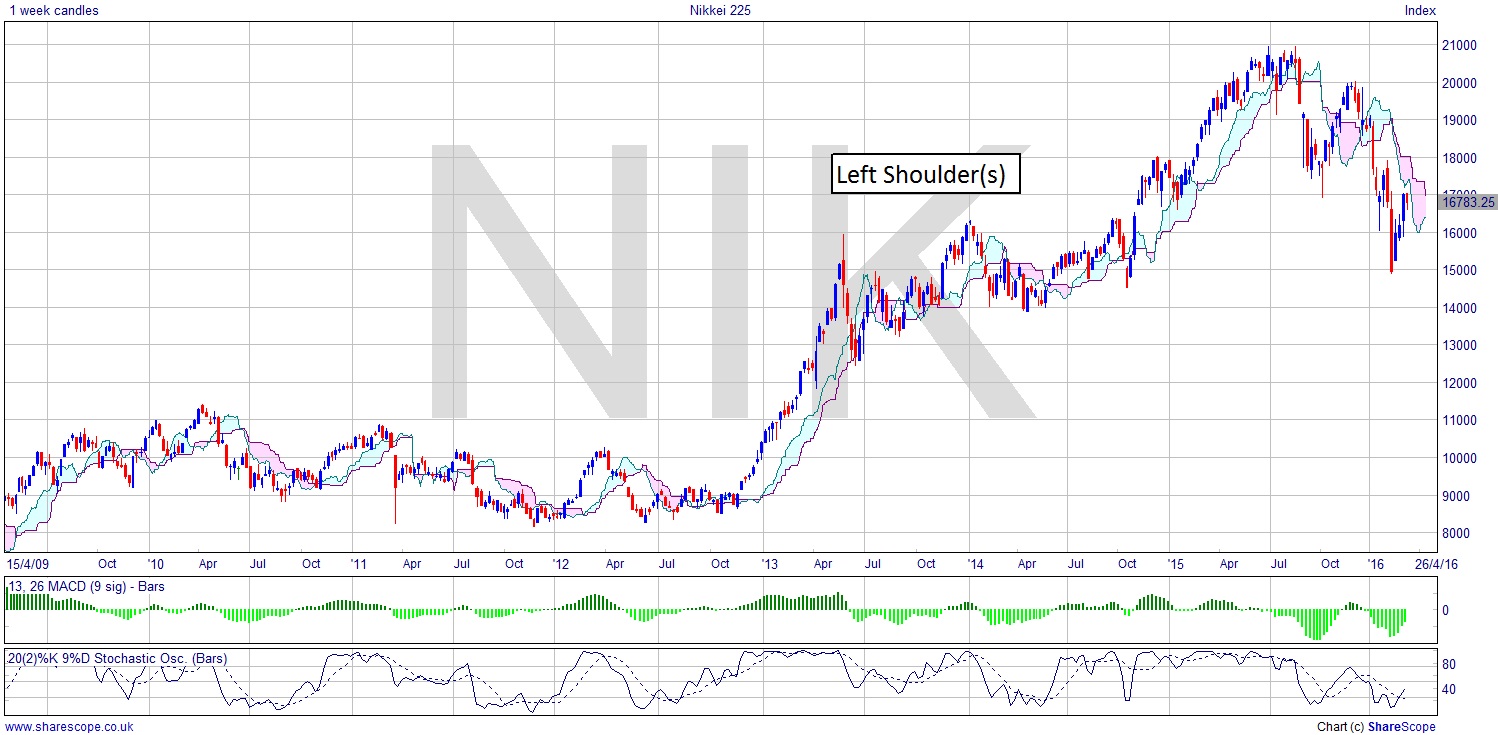
The Nikkei 225 (NIK) took ages to kick-start after the financial crisis. However, since the end of 2012 the Nikkei has more than doubled at its peak. It’s now ahead of the western markets in terms of retracing. The question here now is do we get a multi-year H+S? 2013/14 makes the left shoulder and the head in the middle of ’15. A sideways move here in the same sort of range as we saw then – 14,000-16,000 – would produce a very interesting situation. The Nikkei is a great illustrator of how foolish it is to think of markets in absolute terms. When it was at over 40,000 people would have staked their lives on it not falling to 10,000. But fall it did. And it fell way below 10,000, as you can see on the chart.
The Swiss market is another that’s easily forgotten. Although a lot of private FX traders will happily trade the Swiss Franc, or Swissy, as it’s known, the stock market is less popular. I’ve looked at the iShares MSCI Switzerland Index Fund (EWL) and it’s a great chart. Just look at the Support/Resistance line right across the tops of the noughties and 2011, and the support of the, er… what is this decade called? Is that why not much is happening because this decade doesn’t have a themed name? If we carry on like this the 20th century will win when we experience the Boring Twenties. Anyway, the Support for the lows in 2013 and again this year. That is such a critical level for this stock. An entry point on a rise to a Lower High in the next few weeks or even months would make a great early entry, and with very little support below $28 until $22, and the 50% retracement from the ATH at $36 landing around $24, that’s a decent short-term target range.
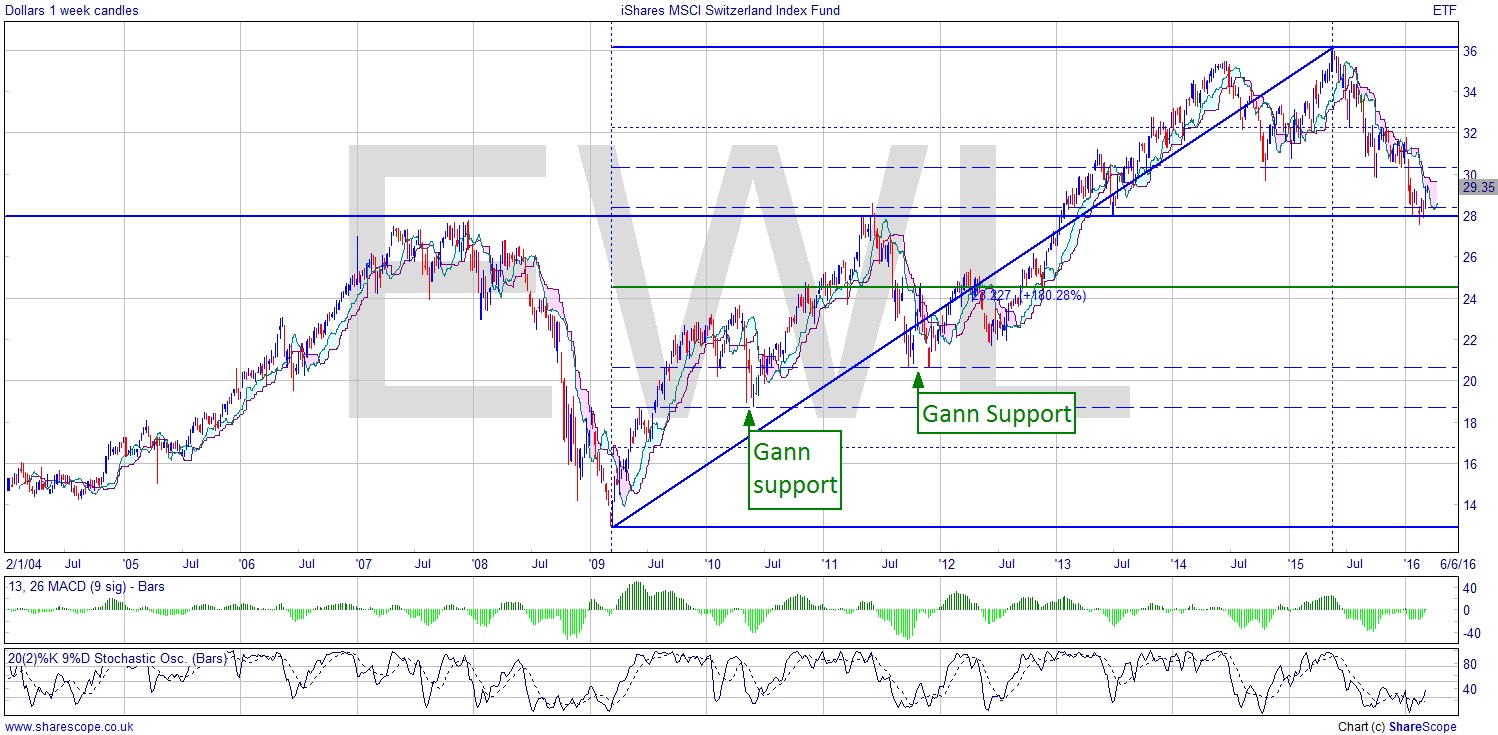
What is interesting here is that the Gann retracement levels I’ve put on (that’s what looks like Fibonacci but isn’t) pick out the support levels between that very significant low in 2009 and the high last year. Gann analysis tends to work very precisely or not at all. These are therefore sound target levels. I spent many a year learning Gann techniques and it’s always nice when decades of work pay off! These levels are useful as areas of potential reversals and a point to tighten stop and perform trade management.
Comments (0)