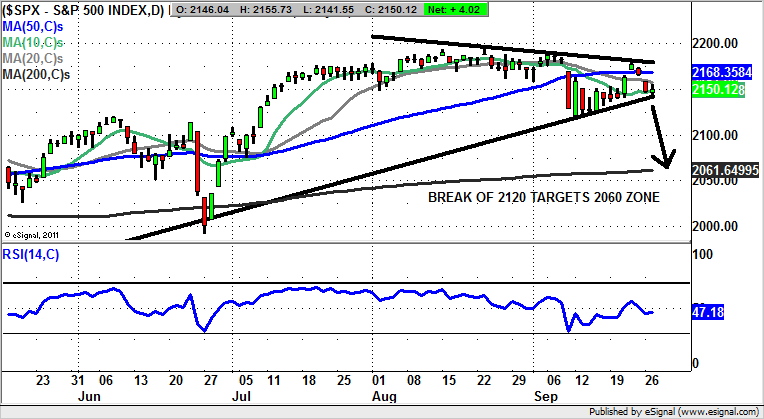
S&P 500 is a perfect charting sell

With Deutsche Bank the next Lehman Brothers on this side of the pond, and a Punch & Judy Presidential Election Stateside, there is no reason and no justification for indices like the S&P to be near all time highs. Only the so called Plunge Protection Team explains why U.S. Stocks are still near the top of the range.
S&P 500: A perfect 10 charting sell
It may seem that I am tempting fate by suggesting that the S&P is a 100% charting sell. I am not. The setup on the daily chart of a gap down through the 50 day moving average, a rebound to fill the gap, a bull trap through the 50 day moving average and the 2 day island top reversal to start this week is the equivalent of a 10/10 Nadia Comaneci Olympic Gymnastic performance. Of course, this does not necessarily mean that the index will fall, but it would suggest that something very special will have to happen for this not to happen. The uncertainty of the U.S. Presidential Election is a decent excuse for investors not to buy, while it is a certainty that Deutsche Bank will have to be bailed out despite Angela Merkel’s protestations. This along with the vulnerability of the stock market at the beginning of the autumn would suggest that unless there is intervention to prop up stocks by the so called Plunge Protection Team (feel free to Google the phrase), there will be a correction for the S&P down to the 200 day moving average zone at 2,061. This is even if the great rally resumes after such a dip. Cautious bears should wait on a break of 2,120 near-term support, whilst the sell theory would be killed off by a break of the August resistance line on the daily chart at 2,180 – something which can be regarded as a Lazarus like scenario.

Comments (0)