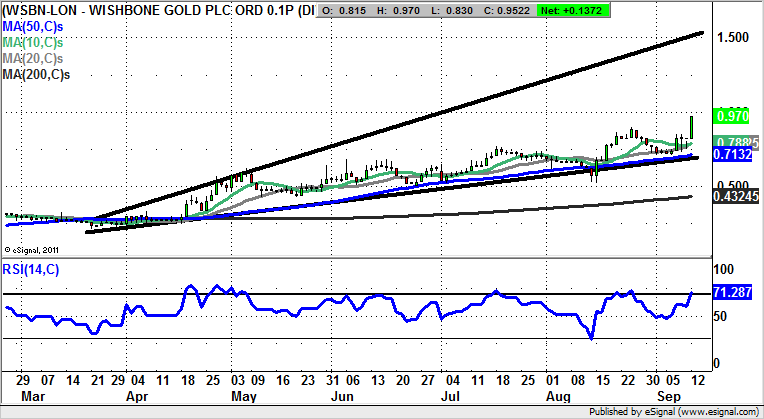
Chart of the Day: Wishbone Gold

The run up to a company returning to profitability can be as positive on a fundamental basis as the technical run up to a golden cross buy signal between the 50 day and 200 day moving averages. In the case of Wishbone it would appear that the fundamentals as well as the technicals are equally positive at the moment.
Wishbone Gold (WSBN): Broadening Triangle Targets 1.5p
Last week saw shares of Wishbone Gold helped along by narrower losses, and this could very well be taken as being a vindication of the move into precious metals trading earlier this year. It has also been stated that the company is on track to meet its target of shipping 100kg of Gold per annum. But it may actually be the daily chart here which gives the greatest confidence in the sense that, when compared to many mining stocks, the ride for this company, which is clearly a decent proxy to the sector, has been relatively smooth. Indeed, we can expect progress to continue within a broadening triangle which can be drawn in from as long ago as March. The resistance line projection of the channel is currently pointing as high as 1.5p, and this is the expected target over the next 1-2 months. At this stage only sustained price action back below the 50 day moving average / March uptrend line at 0.71p would be considered detrimental to the bull scenario. In the meantime, any dips towards the 50 day line are currently regarded as buying opportunities.

Comments (0)