Chart of the Day: Tullow Oil

While it may be argued that we are spoiled for choice in terms of bullish contenders for stock selection now that equity markets are back at highs and looking comfortable, it still pays to pick out the best looking technical situations if only to try to stack the odds of success in our favour.
Tullow Oil (LON:TLW): Gap through 50 Day Line
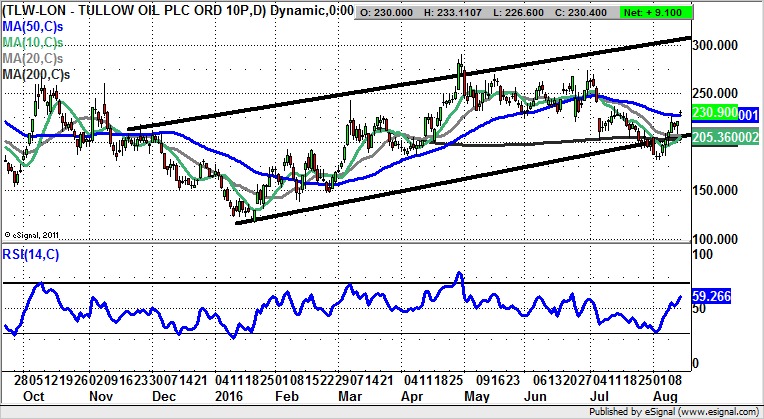
It has not exactly been a happy or easy story for bulls of Tullow Oil in the recent past, with this point made over and above the trials and tribulations regarding the Crude Oil price. What can be seen on the daily chart is that since an island reversal made in January below 125p there has been a steady recovery. All of this has occurred within a rising trend channel which can be drawn in from as long ago as November. The floor of the channel currently runs at the 200 day moving average at 203p. However, the real excitement is provided by the latest unfilled gap to the upside through the 50 day moving average. Such gaps through the 50 day line are very often reliable flags for significant moves to the upside. In this case we may be looking to a journey to the top of a rising trend channel from the autumn currently pointing as high as 300p. The timeframe on such a move is regarded as being as soon as the next 1-2 months, especially while the floor of the gap at 221.8p remains in place as an accumulation zone.

Comments (0)