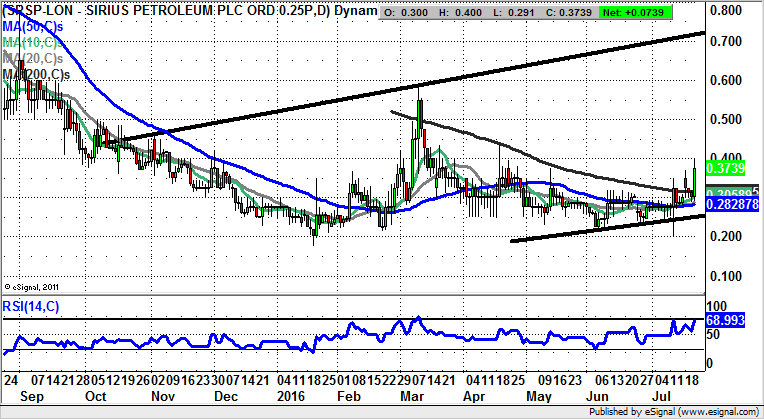
Chart of the Day: Sirius Petroleum

One of the best things about charting is that there are so many ways of arriving at a conclusion – not just with the price patterns, but with a whole number of indicators. Unfortunately, sometimes this is not always a plus point.
Sirius Petroleum (SRSP): 200 Day Line Break
My particular journey in charting has been in progress for over 25 years, and it can be said that I have well exceeded the 10,000 hours one is supposed to notch up in order to become competent at a particular sphere of endeavour. What is interesting though, is the way that as a beginner we tend to use the basic signals and techniques in technical trading, and then get more complex. However, one of the biggest mistakes I see people make is to overcomplicate. Instead, what tends to work best is to go with the simple triggers, with the 200 day moving average / trend changing indicator being one of the best. This can currently be seen on the daily chart of Sirius Petroleum, with the 200 day line running at 0.31p. The clearance of this feature suggests that while there is no end of day close back below it we can anticipate a top of October price channel target as high as 0.7p over the next 1-2 months. Only back below recent 0.25p support would really question the bull scenario. In the meantime any intraday weakness back towards 0.31p can be regarded as a buying opportunity.

Comments (0)