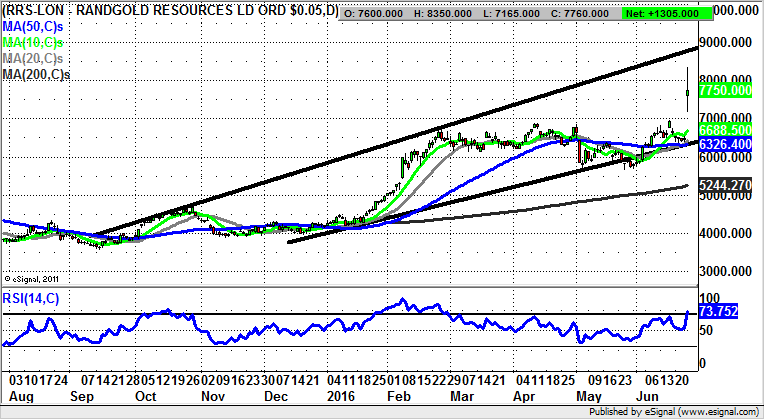
Chart of the Day: Randgold Resources

On a day of shock, surprise, and perhaps for some, horror, on the stock market there was a golden performer. This came in the form of West Africa focused mining play Randgold Resources, one of the most consistent and impressive gold miners on the UK market. The initial mark up here was by over a quarter – stunning, when you take into account the initial 500 points drop for the FTSE 100.
Randgold Resources (RRS): Technical Target towards 9,000p
It can be seen on the daily chart of Randgold Resources that this is clearly a stock which has been building an extended rally for a lengthy period of time. That said, the starting gun on the latest leg to the upside was the extended flag above the 50 day moving average in January, then towards the 4,200p zone, and the golden cross buy signal between the 50 day and 200 day lines for the beginning of February. This was accompanied by an as yet unfilled gap to the upside, with this gap being a major clue as to the momentum behind the upside here. Indeed, it is usually the case that for stocks or markets which leave gaps below on an extended basis, we can rely on fresh significant moves higher. This has of course come through in the wake of the risk off feeling associated with the Brexit victory. The top of the rising trend channel on the Randgold Resources chart is currently pointing as high as 9,000p, with this expected to be the 1-2 months target while there is no end of week close below the top of the latest gap at 7,165p.

Comments (0)