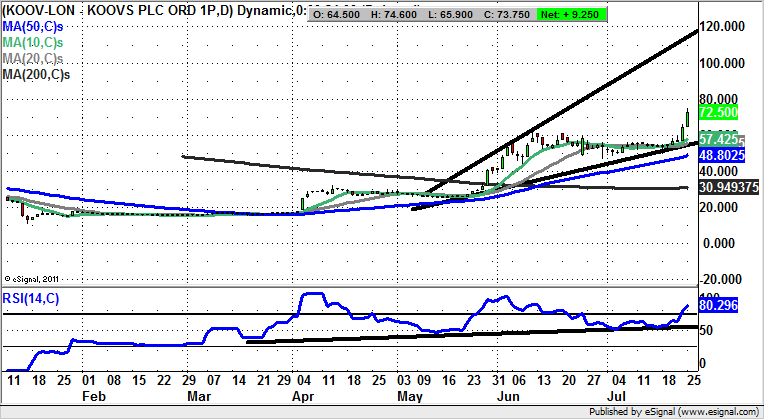
Chart of the Day: Koovs

It would appear that a company which has been labelled as the new ASOS (LON:ASC) has a hard act to follow, but so far at least, it can be said that the share price of Koovs appears to be living up to the hype.
Koovs (LON:KOOV): Above 60p Zone Targets as High as 120p
What can be seen on the daily chart of Koovs in recent months is that we have been treated to many of the best technical and charting drivers one would wish to see in a possible extended bullish situation. This has effectively been in place since the end of May, with the break above the 200 day moving average at 30.94p at the first time of asking.
The main highlights here include the way that new support on the rise has been at and above former resistance – by some margin, which is something you generally only see in the most bullish of situations. The other latest plus points are the clearance of the former 62p June peak and the way that, for the past couple of weeks, the 200 day moving average has started to rise. The message is that while there is no end of day close back below the old June peak, the upside here could be as great as a May resistance line projection at 120p. The timeframe on such a move is the next 1-2 months. In the meantime, any dips towards the low 60s are to be regarded as buying opportunities, especially given the way the RSI, now at 80/100, is very overbought.

Comments (0)