Chart of the Day: Jimmy Choo

Considering that the last pair of shoes I purchased was £29.99 at Top Man, it could be argued quite fairly that the Jimmy Choo proposition is not really something which I espouse. But then again, with the stock market, knowing when to separate business from pleasure is all important.
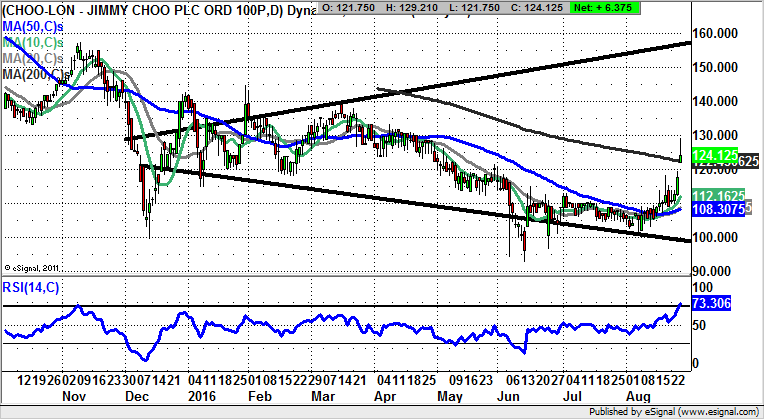
Jimmy Choo (CHOO): Broadening Triangle Targets 150p Plus
While it may be the case that the fundamentals at Jimmy Choo are something which only enthusiasts – and of course its customers – can fully embrace, the charting position is not only relatively clear cut, but also quite compelling. This idea stems from the way we have seen an important series of positive charting events since June. Indeed, that month witnessed three intraday probes below the former December support at 100p. Therefore, the triple bear trap reversal from below the big round figure started the recovery here for the shares. Since then, there has been higher support above 100p for August, plus a push back above the 50 day moving average, now at 108p. Therefore, the overall view is that while above the 50 day line Jimmy Choo can be regarded as a strong bullish situation, while the latest gap through the 200 day moving average at 122p allows us to conclude we are looking at strong momentum here. The favoured destination over the next 1-2 months while above the 50 day moving average is as high as the top of a broadening triangle from December, with its resistance line projection currently pointing to 150p plus. In the meantime, any dips towards the 120p zone to improve the risk / reward of going long are regarded as buying opportunities.

Comments (0)