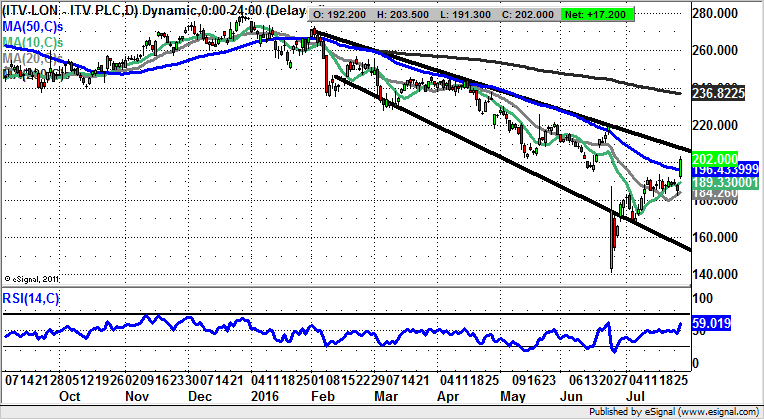
Chart of the Day: ITV

Mystery and the stock market may be two things that go hand in hand for some, but it is usually the case that we have a rational explanation both for sentiment and value. In the case of the recent sell off and rebound for ITV it looks as though the market is reassessing its previous negative view.
ITV (ITV): Island Reversal Points to 200 Day Line
It feels as if investors never really recovered from the end of Downton Abbey, and have been punishing shares of the broadcaster ever since. In the more recent past the issue here appeared to be concerns over advertising spend, especially in the run up to the Brexit vote, which as it went the “wrong” way caused an extra sell off. However, it is still the case that ITV has a strong position in its sector, and is still an effective money-making machine. This point is underlined on the daily chart by the way we have been treated to an island reversal – formed by a gap to the downside, followed by the latest to the upside. The implication in the aftermath of what is one of the strongest patterns is that we should be due an extended turnaround. The favoured destination in this respect would be back towards the main near-term resistance, currently standing at the 200 day line level of 236p. This could be hit as soon as the next 4-6 weeks, especially if the shares can clear the early 2016 resistance line at 207p over the next few sessions.

Comments (0)