Chart of the Day: HSBC

Anyone wondering whether the post-Brexit state of flux might be good for at least some banking stocks need look no further than the internationally focused HSBC and the mega rally of recent weeks.
HSBC (HSBA): 620p Technical Target
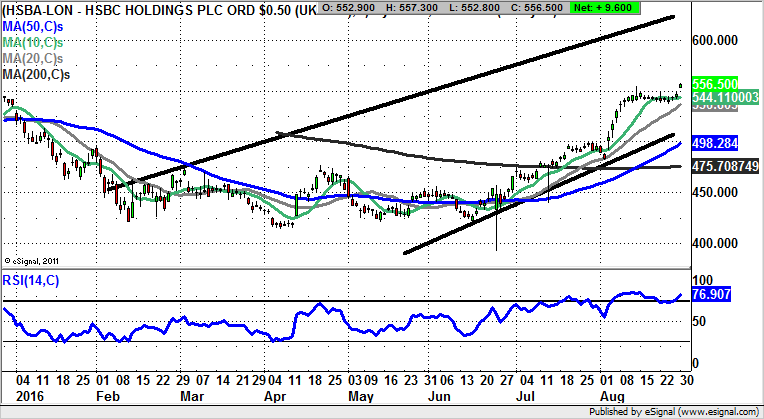
It would appear that the banking sector on the London Stock Exchange is split quite cruelly between those with a largely domestic focus, such as Lloyds (LLOY) and RBS (RBS), and the plays which have a decent foreign exposure. This factor of having an overseas stream of income is important, both in terms of being hedged against the possibility of a recession in the UK, and as a hedge against the weaker Pound. All of this is shown on the daily chart of HSBC, where we have a rising trend channel which can be drawn in from as long ago as February. The resistance line projection of the channel is pointing as high as 620p, which suggests that provided there is no break back below the 20 day moving average at 536p we should be treated to a decent move higher to add to the solid gains of the past couple of months. Indeed, 620p could be hit as soon as the end of September. In the meantime any dips towards the 20 day line to improve the risk / reward of going long are regarded as buying opportunities, even though this seems unlikely in the wake of the latest gap to the upside.

Comments (0)