Chart of the Day: Finnaust Mining

It is usually the case that I prefer to look on the bright side as far as stocks and markets, especially as this tends to be the angle most private investors are most comfortable with. The question is whether with Finnaust Mining this is the best approach at current levels.
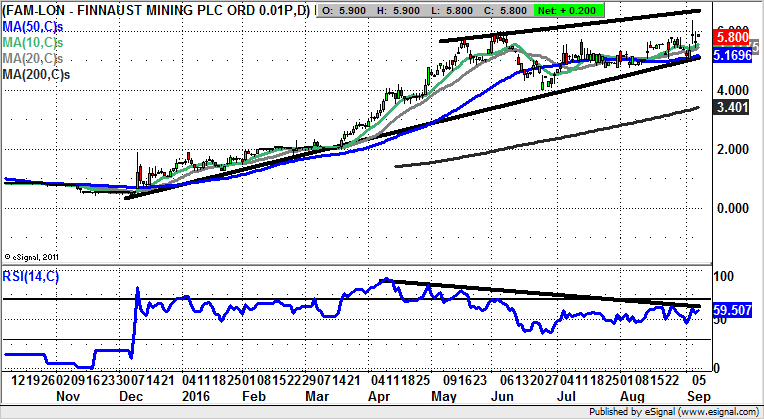
Finnaust Mining (FAM): Wedge Formation Risks 4p Retest
Finnaust Mining has been a decent servant for those looking to be long of mining minnows, a point which is testified to by the recent rise in the stock over the past 10 months. Indeed, the technical starting gun was the unfilled gap to the upside through the 50 day moving average, then at 0.7p and now well up at 5.16p. This notional support zone from the 50 day line is underpinned by a line of support which can be drawn in from the end of last year. Clearly, while above the December uptrend line / 50 day moving average it is difficult to get too bearish on the stock from a charting perspective. The main negative at this stage is therefore the idea that since the end of April the stock has gone into a bearish rising wedge formation, one which after the recent slowdown in progress may snap to the downside. Of course, it would be best to wait on the 50 day line to break. But the pressure caused by a RSI resistance line at 65/100 – just above present levels and the latest third main failure to hold 6p could make Finnaust Mining a possible bear contender for aggressive traders. This is something to consider for those long of the shares. Below the 50 day line risks a test of the post April 4p zone.
Comments (0)