Zak’s Weekend Chart Round-Up

FTSE 100 Stocks
Barclays (LON:BARC): Time to Mind the Gap
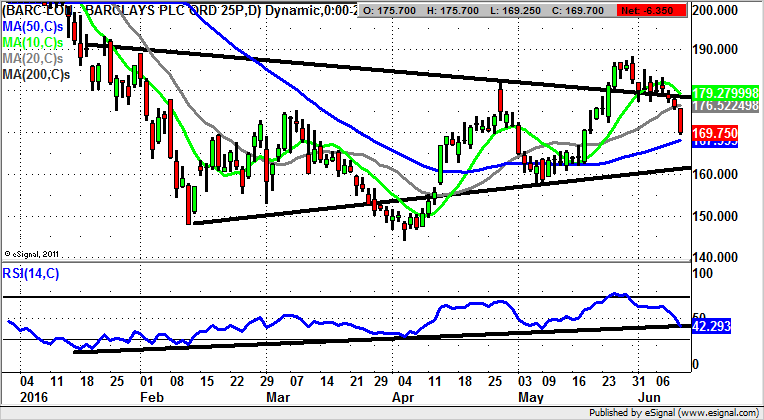
It has been in interesting year to date for UK banking stocks, with a relatively predictable spread between the domestic focused players, who have done rather better than those exposed to emerging or submerging markets. That said, one supposes that the likes of Barclays have faced headwinds from the so called challenger banks, which do not have the legacy losses which the rather unfortunate RBS (LON:RBS) is apparently still trying to get over. It is in fact still losing some £30m a day. As far as Barclays is concerned we had been treated to a decent rally which can be seen on the daily chart from as long ago as February, although there was that final bear trap rebound from below 147p from April. Perhaps the points to note since then are the way the stock has left behind a gap at 156.75p from April, and in the more recent past, the May bull trap reversal from above the April 182p peak and far below the 200 day moving average at 201p. The view now is that we risk a test of the gap floor at 156.75p over the next 2-4 weeks, even if we are then treated to further recovery. The risk is therefore that while there is no end of day close back above the 10 day moving average at 179p, the gap floor is the target. Only cautious traders should wait on a break of the extended January uptrend line in the RSI window at 42, versus 42.29 now, before taking the plunge on the downside.
British Land (LON:BLND): Gap Fill Failure
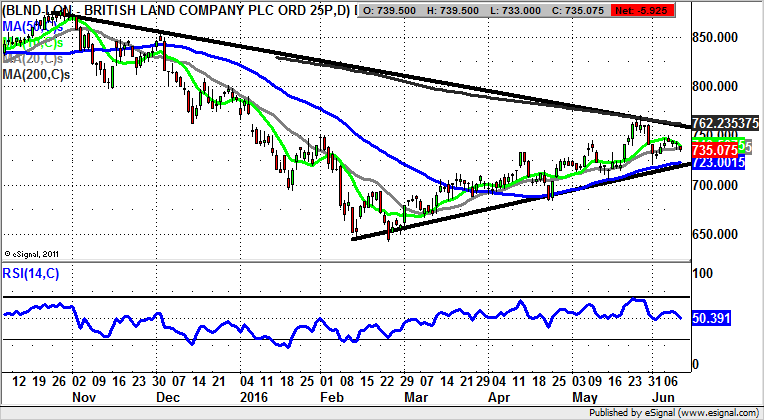
One of the best ways of making progress in charting is to have just a few key technical triggers you trade off. They can be moving averages, RSI or stochastics. But perhaps the best objective charting features are gaps, either to the upside or the downside. What can be seen on the daily chart of British Land is the way that there was a gap to the downside in January, with the top of the gap at 770p. This traditionally is regarded as new resistance after a stock or market breaks down, and this is almost exactly how things have panned out for shares of British Land ever since. Indeed, the peak ever since has been 771p, which suggests that technical traders could have had their orders in at 769p or 770p and had a chance to go short in anticipation of the next leg down. The message now is that we are looking at not only 771p as resistance, but also a line of resistance from October level with the 200 day moving average at 762p. On this basis one would imagine that while there is no end of day close back above the 200 day line this stock will at least head down to the bottom of the late 2015 triangle at 723p / 50 day moving average. As little as a weekly close below this risks the chance of a partial or even full retest of the 2016 support just below 650p over the following 1-2 months.
Rolls-Royce (LON:RR.): Failure at 200 Day Line
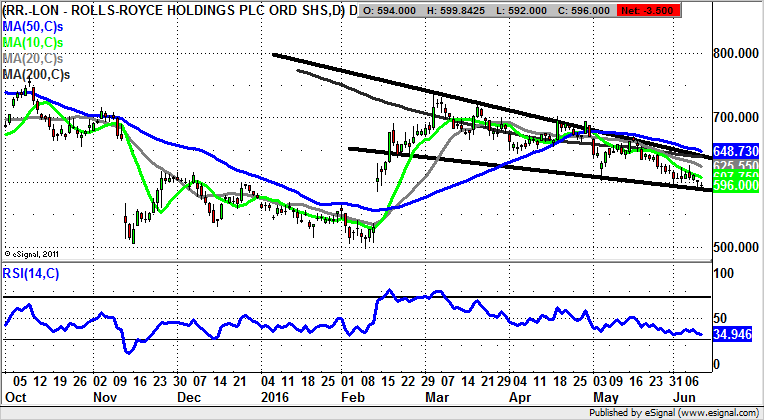
It would appear that former jet engine maker and now profits warning generator Rolls-Royce has seen the nascent recovery of its shares in the post February period. What will be key now is whether the top of the February gap at 585p comes in as new support. If it does not then we would fear a test of the bottom of the gap at 536p. However, for fans of the stock, only back below the gap floor would really imply that the bottom fishing argument here was finally over for the near term. The ideal scenario is that Rolls-Royce gets back above its 200 day moving average at 639p / January resistance by the end of this month. Alas, this appears to be a rather over optimistic wish at present.
Small Caps
Immupharma (LON:IMM): V Shaped Bull Flag Targets 60p
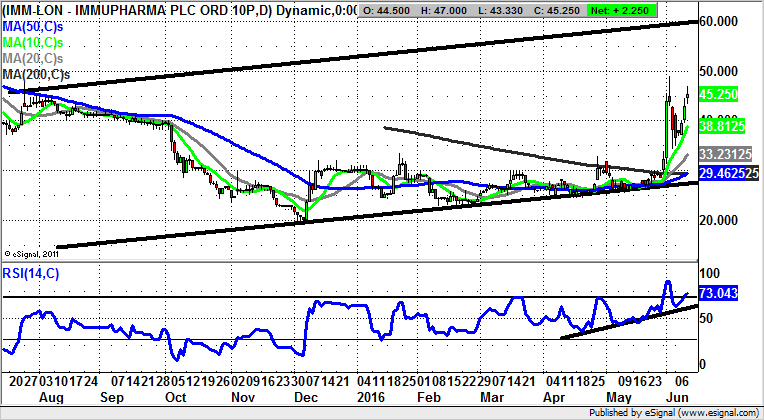
One of the best ways of conquering small caps is to seek out the plays which have the most robust looking charting setups. This will mean that the winning candidates have extended bases, with slow burn turnaround, after relatively clean breaks of the trend changing 200 day moving average. In the case of Immupharma we see how there was a near vertical clearance of this feature, now at 29p, at the end of last month – second time lucky for the bulls. What has happened since then is that the price action has gone into a V shaped bull flag which suggests we are witnessing a mid move consolidation ahead of a fresh leg to the upside. As things stand, one would expect the shares to head as high as the top of a July 2015 rising trend channel at 60p, with the timeframe on such a move regarded as being as soon as the next 1-2 months. At this stage only sustained price action back below the former October resistance at 40p is regarded as even beginning to delay the upside scenario. In the meantime, any dips towards the 40p zone to cool off the overbought RSI at 73 are regarded as buy opportunities.
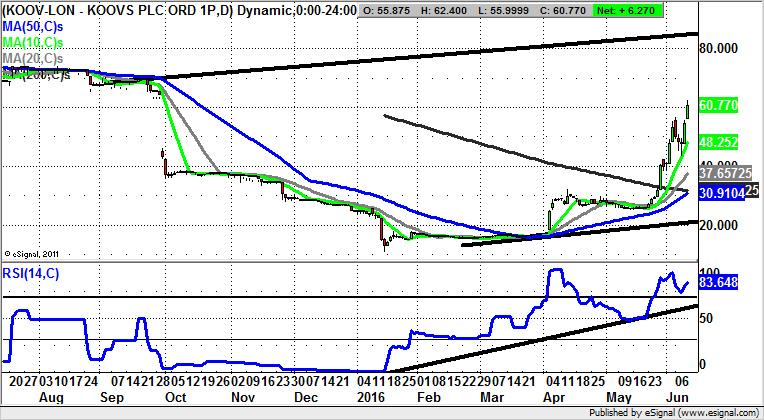
Koovs (KOOV): V Shaped Bull Flag Targets 85p
If anything, for Koovs we have an even more solid charting picture than the already very robust setup at Immupharma described above. Here the shares cleared the 200 day moving average, now at 30p, at the first time of asking last month, after having gapped through the 50 day moving average at sub 20p in April. The expectation now is that provided there is no end of day close back below the present level of the 10 day moving average at 48p, we should be treated to a September price channel top level of 85p as soon as the end of next month.
Comments (0)