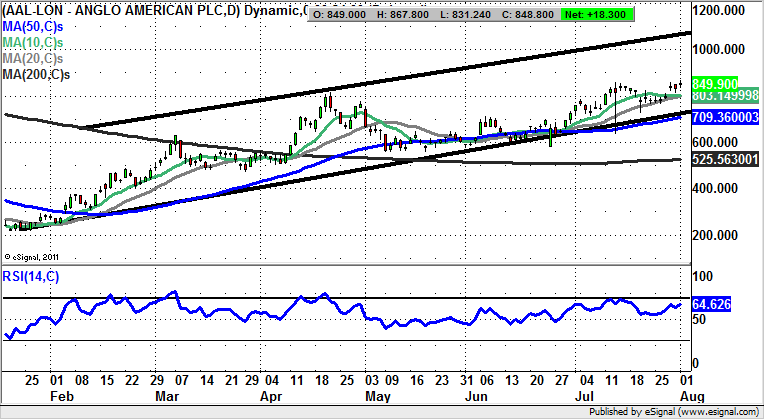
Chart of the Day: Anglo American

Given that shares of Anglo American have been one of the best recovery situations on the London market for the year to date, it seems almost churlish to look for more upside, but it could very well be the case that this is the correct thing to do.
Anglo American (AAL): Upside towards 1,000p Plus
What can be seen on the daily chart of Anglo American is the way that the great recovery of 2016 started with an island reversal for January, followed by an as yet unfilled gap to the upside through the 50 day moving average then at the 300p mark. Even better, the big turnaround here started before the overall rebound for the stock market on February 11, the kind of positive divergence that many a technical trader would always be very keen on. Since then we have been treated to progress within a rising trend channel which can be drawn in from as long ago as the end of January. The floor of the channel currently runs at 709p, level with the 50 day moving average. However, this situation appears to be so robust it would be surprising if there was any sustained weakness back below the 10 day moving average at 803p. Above this feature the upside could be as great as 1,050p at the top of the 2016 price channel, with the timeframe on such a move regarded as being the next 4-6 weeks. In the meantime any weakness back towards the 10 day line to improve the risk/reward of going long is regarded as being a buying opportunity.

Comments (0)