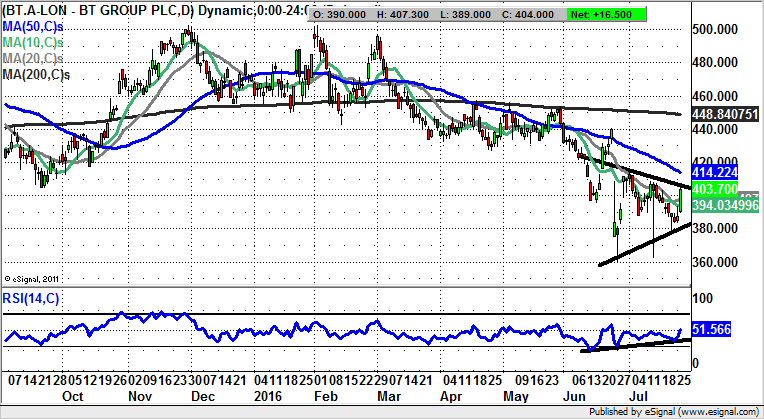
Chart of the Day: BT Group

It may be said by uncharitable souls such as myself that BT Group has been squirming like a toad regarding its dominant position in the market with its Openreach operations. However, it could be argued that the blame lies with the “regulator” Ofcom.
BT Group (BT.A): Triangle Breakout Back Towards 450p
What is evident on the daily chart of BT Group is that the shares have been hit hard in the recent past. This was not only in the run up to and in the immediate aftermath of Brexit, but a long time ahead of the vote as the price action topped out. This was seen as long ago as the turn of the year with the triple top towards 500p, and the way that the shares were struggling to hold the 200 day moving average, now at 448p. In fact, the 200 day line was finally lost in March, with the three failures at this feature from April simply underlining how weak the charting and technical position had become. The position now is that after being beaten down we are cautiously looking for recovery, with the buy trigger as little as an end of day close above the top of last month’s triangle formation at 407p. If this can be achieved later in the week, one would be looking to a return towards the 200 day line over the next 4-6 weeks. Only back below the 380p formation floor really delays the upside scenario.

Comments (0)