Is an Oil Spike Coming?

The general consensus on the street has been bearish on Crude since the US became a self-reliant energy producer and exporter. This, coupled with more energy-efficient vehicles may have subdued demand and brought oil prices down to multi-year lows (currently $49.00). While Russia does not want to cut production, increasingly many OPEC nations are considering it, resulting in supply uncertainty. To top it off, latest US rig count data showed an increase in rigs. We would like to propose a somewhat contrarian view relative to the street; namely that Oil may be due for a spike and we do stress ‘may’ as it is a volatile asset and one that is subject to a range of global macro-economic and political variables.
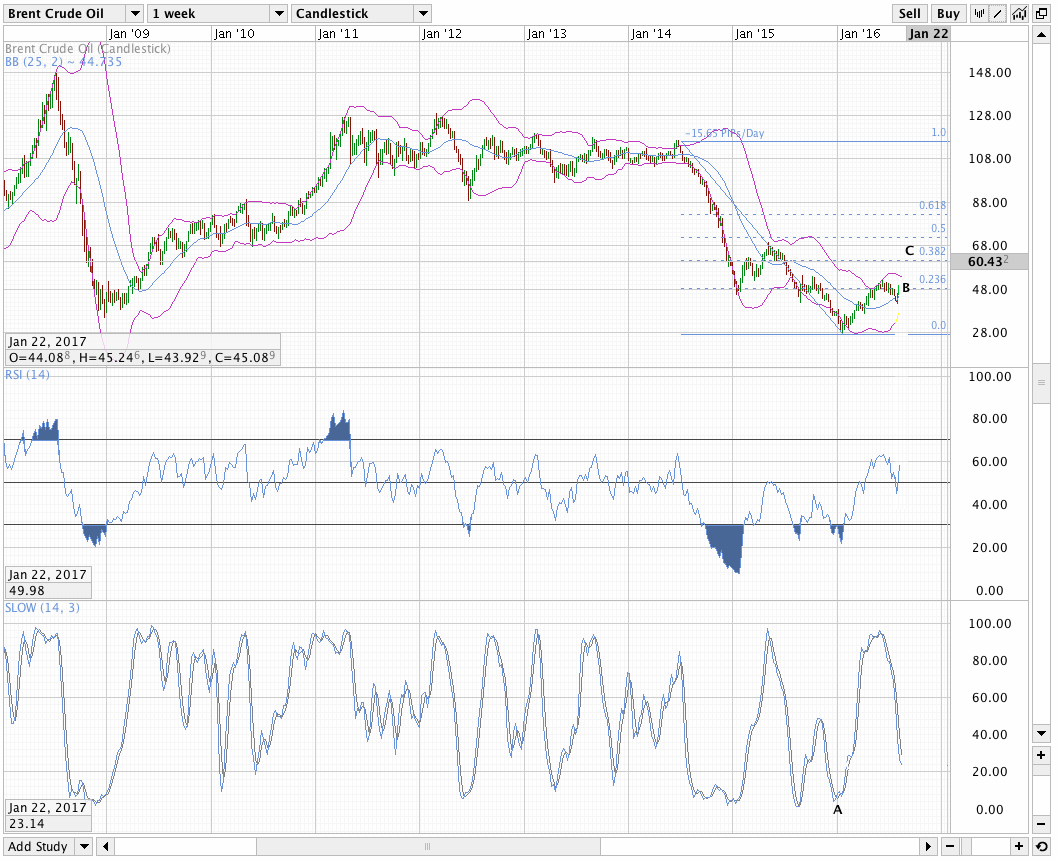
Our reasoning, however, is predominantly based on chart technical analysis. Looking at the weekly chart since 2006, the hedge-fund driven oil price spike surrounding Lehman Brothers in 2008 marked the multi-year high for the commodity when prices reached $147.00 for a few hours. This resulted in a stochastic and RSI peak followed by a very sharp drop off, mainly driven by a global economic slowdown. Over the years as the economies recovered, oil did too reaching a post-Iraq “new normal” of over $100.
Fast forward to today, and the price found a near-term bottom at around $27.00, experienced some degree of a ‘dead-cat-bounce’ to $50.00 and experienced downward pressure again, predictably, after hitting the 23.6% Fibonacci retracement level. As the stochastic reading on Exhibit A (point A) shows, Oil has found significant support and bounced off a deeply ‘oversold’ stochastic reading of around 5 back in January. Currently the reading is around 50, meaning that in the near term, there may be some lack of direction, perhaps even some weakness, given it has breached the 23.6% Fibonacci level from below this month (Exhibit A, point B). But should it retrace to the $35-38/barrel mark, the price may experience some lift-off to tag the second Fibonacci retracement level of 38.2% or around $60/barrel (Exhibit A, point C), indicating a possible c. 60% upside, or from current levels (c. $49.00), a potential 22% upside.
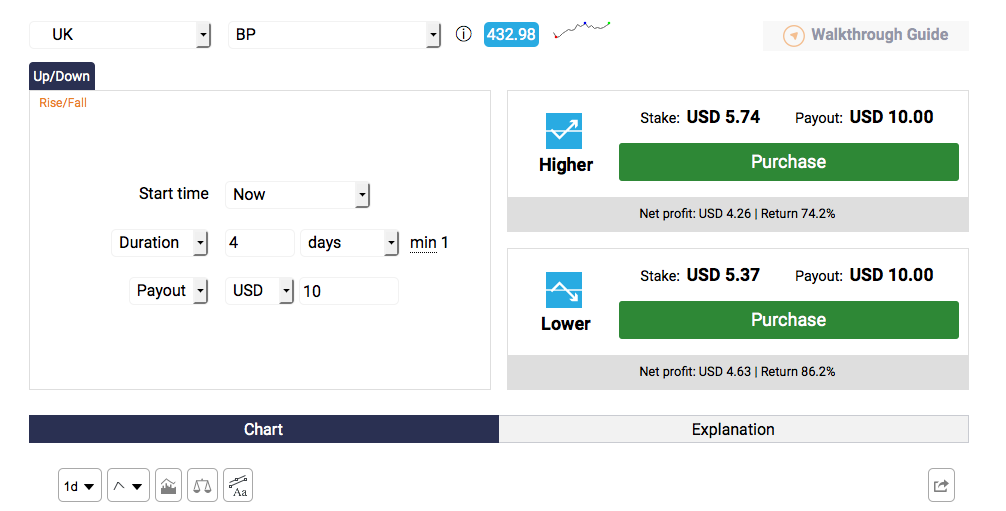
The higher risk play here would be to not wait given the momentum. However, given that it is oil and any macroeconomic or geopolitical uncertainty could whipsaw it back into submission, caution is advised. Any long positions, instead, should be considered on pull-backs. As this trade may take a few weeks, if not months, to play out with expiry possibly end of this year, the Binary.com Trade area allows payouts of around 70-90% (depending on market conditions) should the price upon expiry be higher than the time you enter (known as a binary option). This is seen in Exhibit B with the shares of British Petroleum loaded on screen, a direct beneficiary of higher oil prices.
Risk Disclaimer: The above is not investment advice and is for educational purposes only. Commodities and binary option trading is risky and may result in financial losses.


Comments (0)