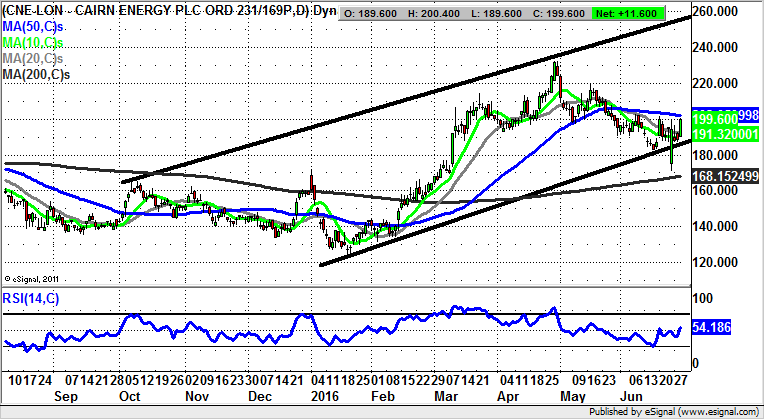
Chart of the Day: Cairn Energy

To coin a term I picked up before the EU Referendum, I am suffering from a degree of Brexhaustion, and therefore it seems wise not to pour oil on troubled waters. Rather, I’ll take a look at the oil & gas sector and a possible opportunity there…
Cairn Energy (CNE): Break of 50 Day Line Targets 260p
Cairn Energy is a company which has provided something of a rough ride to say the least in recent years, a situation which has only been exacerbated by the volatility in the Crude Oil price. The focus continues to be on the group’s resource in Greenland, as well as the recovery in the underlying commodity back to $50. What can be said now is that from the bullish perspective we have been treated to a very pleasing recovery over the post January period, with an as yet unfilled gap to the upside made that month. This keeps us on alert for price action which could exceed expectations. As far as the outlook for the next 2-3 months, one can say that as little as an end of day close above the 50 day moving average at 202p could see Cairn Energy exploit the momentum which seems to be gathering in the wake of the Friday floor put in after the shock Brexit result. This took the shares down to 171p, above the 200 day moving average – and enough to underpin the idea of a major swing low being in place. It is usually the case than when the bears are unable to get a stock or market back below this feature in the wake of a sudden burst of volatility, we should give extra credence to the upside argument.

Comments (0)