Central Rand Gold: Wedge breakout targets 200 day line at 1.82p

Perhaps the most polite description of shares of Central Rand Gold (LON:CRND) is that the shares have been one of the Cinderella plays of its particular sector.
It really has not been a great ride for bulls of Central Rand Gold, with the great issue here being not so much the decline in the stock, which has mirrored the fall in Gold, but the fact the underperformance is in stark contrast to the massive rallies seen in the major miners.
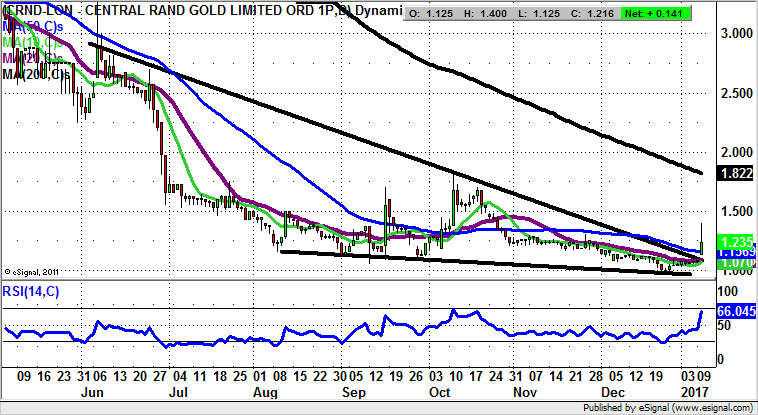
What we can see here on the daily chart is that Central Rand Gold is way down on the glory days of 2014 – 2015 when the stock was trading well above 20p. However, the hope for the start of 2017 is that we are finally seeing the kicker for a recovery, even if it is only an intermediate one.
The favoured scenario in the wake of the latest gap to the upside is a move through the top of a falling wedge formation in place since the middle of last year. The line of the wedge runs through the 1.07p level – the position of the 10 day moving average. But it will be the 50 day moving average at 1.15p which is key over the near term.
Indeed, the technical call here is that provided there is no end of day close back below the 50 day line, one would be looking for a rally towards the present position of the 200 day moving average at 1.82p over the next 1-2 months.

Comments (0)