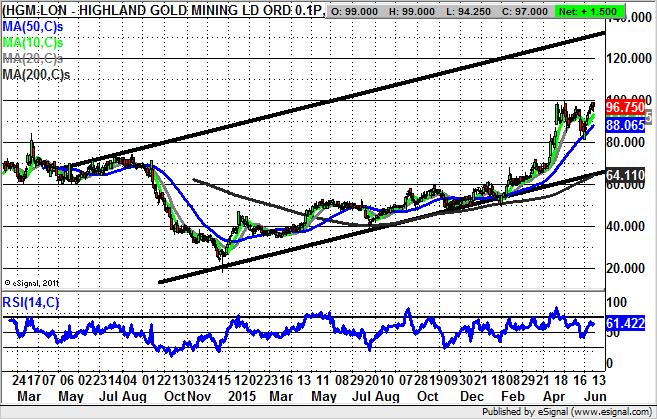
Chart of the Day: Highland Gold Mining

Although for much of the five years that the mining sector spent in the wilderness we were told by the “experts” that the time to buy was now, it is ironic that when the real turnaround came at the beginning of this year these optimists were rather quiet. Also worth noting is the way that in most cases the stocks which were supposed to go up did not actually perform as expected.
Highland Gold Mining (LON:HGM): 2014 Price Channel Target at 130p
Highland Gold Mining has to be regarded as something of a backwater play in the mining sector, and indeed, on gold itself. But perhaps the most interesting aspect here is the way that the shares delivered their big turnaround as long ago as December 2014, over a year before we could detect the big recovery for its peers. What can be seen on the daily chart since then is the way that last April the recovery of the 200 day moving average, then towards 45p, consolidated the gains and acted as support for the fresh upside which was to follow. The present situation is that the baton has been handed to the 50 day moving average at 88p, with the likelihood being this will act as a dynamic end of day close stop loss for those seeking fresh upside. In fact, it should be the case that provided there is no end of day close back below the 50 day line, we could see a technical target as high as 130p. This is because the resistance line projection of the wide 2014 rising trend channel is pointing as high as this figure. The timeframe on such a move is expected to be as soon as the next 2-3 months.

Comments (0)