Book Review: Technical Analysis and Stock Market Profits

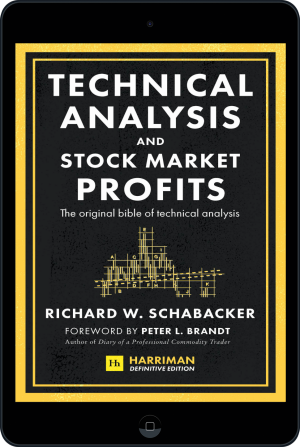
Ahead of its 90th anniversary, Harriman House has re-released Technical Analysis as part of its Definitive edition series with a new foreword from commodity trader Peter L. Brandt. Richard Gill, CFA, reviews.
According to the much-maligned efficient market hypothesis, the future movements of a share price cannot be determined by looking at charts of its past performance. In other words, the EMH argues that technical analysis is useless. Instead, stock prices are thought to move according to a “random walk” – like a drunk person stumbling home, you can’t predict where they will go next! Many would disagree with this viewpoint however, with charting being a widely used method of financial analysis by millions of traders around the world as they try to identify profitable opportunities.
In the 21st century, with powerful software packages available, technical analysis has never been easier to perform. But it has in fact been around for hundreds of years, with early pioneers painstakingly drawing out charts and patterns by hand. Early work on the subject was carried out by Amsterdam-based merchant Joseph de la Vega on the Dutch financial markets in the 17th century. Then in the 18th century Japanese rice merchant Homma Munehisa pioneered the use of the ever popular candlestick techniques.
But it wasn’t until the early 1930s, when Richard W. Schabacker wrote Technical Analysis and Stock Market Performance, that the subject really began to take off as a serious analytical approach to investment. During his short lifetime (he died aged just 36), Schabacker rose to the position of Financial Editor of Forbes magazine and published three books on contemporary investment practices, Stock Market Theory and Practice, followed in 1932 by Technical Analysis and in 1934 by Stock Market Profits: A Course in Forecasting. Ahead of its 90th anniversary, Harriman House has re-released Technical Analysis as part of its Definitive edition series with a new foreword from commodity trader Peter L. Brandt.
Charting Course
Schabacker wrote his seminal tome as a practical course for investors, coming on the back of increasing demand for knowledge on the technical approach to successfully trading stocks at the time. He divided it into 12 lessons, or studies, with every point on classical charting principles taught in a clear manner and having a practical use. Based on meticulous research, the book was aimed at the average man who spent an hour or so a day trading, as well as professional full-time traders. Overall, the course was designed to help readers spot profitable opportunities for themselves and then to act on them with confidence.
Study I kicks off with the basic concepts of the technical approach to trading, with a list of all aspects covered listed in a handy page at the start. Schabacker, while explaining exactly what a stock chart is in simple terms, reminds readers that this is an advanced course and that some decent knowledge of the stock markets is required. The role of charting as an analytical tool is explored, with other introductory concepts including definitions of stock price movements and trends. While much of the material on sourcing and creating charts is many years out of date (he advised on drawing them yourself!), it provides a fascinating insight into how early practitioners went about their business.
The next three studies go into depth on what are considered to be the most important “reversal formations” and how to identify them. These types of price pattern are a key area of technical analysis, potentially indicating a change in the direction of a trend and thus a profitable trading opportunity. Schabacker describes these changes, or “turns”, as the most important general element of technical analysis. Much of Study II is dedicated to the head and shoulders pattern, two smaller price movements surrounding one larger movement, that is said to predict a bullish to bearish trend reversal and is believed by many chartists to be one of the most reliable trend reversal patterns. Other formations covered include symmetrical triangles and double tops and bottoms.
Study VI moves on to explaining “continuation formations”. In contrast to reversals, these are intermediate sideways patterns which interrupt a previous movement and predict that a trend will continue after a brief pause. For example, after a huge rise in the price of a stock, buyers can often step back to catch their breath. Due to these actions, prices consolidate and end up forming certain patterns, following which the previous trend resumes. Again, money making chances can pop-up once these trends appear. Of course, they don’t always work, and throughout the book the author gives equal weight to a formation’s potential as well as its flaws.
The rest of the studies cover more important technical analysis principles including how support and resistance levels work, how to identify so called “false moves”, and the theory behind trend lines. The final study provides readers with some useful trading tactics covering the best types of stocks to chart, how to avoid over-trading, and perhaps most important of all, the requirement to have patience in your trades.
Charting History
Technical Analysis and Stock Market Profits is widely regarded as one of the best books ever written on technical analysis. Despite being written in 1932 the principles are still applicable to technical analysts today. In fact, in his foreword to this reprinted edition, Peter L. Brandt states that he owes the success of his career to this book. So if you want to learn how to read charts, this chunky and informative volume, coming in at over 450 pages, should be on your shelf.
Quite interesting