Seeking for Value Out of the Current Frenzy

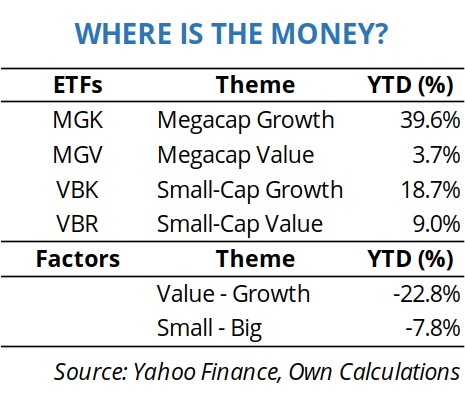
Using words from Bill Blain, “much of the tech stocks we pour dollars into are hopelessly overvalued and the benefits they claim are massively over-exagerated”. Investors have been insanely optimist about the future, pushing the prices of megacaps like Apple, Amazon, Tesla and Nvidia massively higher in a short period. As I emphasised in ETFs For Increasing Volatility and Recession, the current market rally isn’t broad-based. Growth megacaps are rising almost 40% while their value counterparts are near flat. On the opposite corner of the market, growth small-caps are up 18.7% at par with the broad market while value small-caps are rising 9%. The current rally is centred around megacaps and growth.
There’s nothing wrong about growth. But, I find it strange to combine megacap and growth, because mega companies tend to focus more on reshuffling existing technologies rather than on true innovation and rapid growth. But investors are fascinated with the strong bet on AI from these companies and are taking onboard to benefit from the trend. As I exposed in my last blog, I believe value will prosper in the near future over growth, as interest rates start biting. Moreover, many of the stocks investors are buying have poor balance sheets and huge debt loads. Even if the Fed and other major central banks stop hiking rates, I would not expect a reversion of policy anytime soon. Therefore, paying interest and servicing debt will become a heavy burden for many companies, particularly if the economy loses strength.
With all the above ideas in mind, I prefer to seek for value and sound balance sheets and eventually miss some of the potential upside. A good night’s sleep is worth more than the remaining upside in growth stocks. For that sake, I’m using a quantitative strategy instead of buying an ETF. If you prefer the ETF way, you may wish to look at my last blog instead. So, let’s define a few stock filters and select a portfolio for the upcoming correction.
Choosing The Filters
There is no specific set of filters available to effectively capture companies that possess both value and are debt-free. I need filters that capture companies with strong balance sheets that have low debt and can provide good returns on capital. At the same time, these filters should preferably be easily implemented.
Enterprise Value to EBIT
This is a value filter similar to the P/E ratio. However, instead of considering the equity value, it takes into account the value of the whole corporation. In comparison to the P/E ratio, this ratio also replaces net profit by operating profit, a metric that is less exposed to manipulation. Lower values are better.
Net Debt to Enterprise Value
If cash is king, debt is a thorn, particularly when interest rates are rising. The FED hiked its rate by 500 bps in one year, which translates into a heavy burden for companies with high debt loads. To select companies with just moderate leverage, I use the 12-month trailing ratio of net debt-to-enterprise value. I’m looking for companies with a strong financial position that can withstand difficult times without facing financial difficulties due to excessive borrowing. This ratio may be negative when companies carry more cash than borrowings, as net debt discounts cash holdings from the debt load. Lower values are better.
Interest Cover If there’s debt in a balance sheet, then I want to make sure the company is able to repay it. If a company can’t pay interest, it has two options: it can seek more financing from outside sources or issue new equity, which will make the current shareholders own less of the company. A high interest cover ratio puts a company in a more comfortable position. Once again, I will be using the trailing 12-month figure to calculate this ratio. Higher values are better.
Return On Capital Employed (ROCE)
I want to select companies making the highest profits out of the money employed in the business. ROCE measures profits before interest and taxes and is more precise than return-on-assets (ROA) or return-on-equity (ROE), as it takes into account all money employed in generating profits. I’m using a 12-month figure. Higher values are better.
Cash Return On Capital Employed (CROCI)
Making a profit is one thing, realising that profit is another. I want companies that make profits and are able to convert it into cash flow with ease. At the same time, it’s much more difficult to overstate cash than profits. To address this issue and just select the real cash-generating companies, Again, I’m using a trailing 12-month CROCI figure. Higher values are better.
Realised Volatility Over A 12-Month Period
To select the less volatile stocks, I use the 12-month standard deviation of daily returns. This gives an idea of how volatile the stock is. Lower values are better.
Unlike what most investors do, I don’t screen out stocks based on particular figures for each ratio. At least not at this point. The main reason is that I believe that provided the stock market is cyclical, we must capture metrics in relative terms, not absolute. Therefore, I want to pick the best out of what I have right now rather than of what ever existed.
I start with a list of 1.881 US stocks. The next step involves computing median values for each of the ratios above and excluding the worst half. I exclude stocks as follows:
- EV to EBIT > 17.7
- Net Debt to EV > 23.1
- Interest Cover < 6.6
- ROCE < 9.3
- CROCI < 5.5
- Volatility > 2.4
Unlike the absolute figures, these median numbers are based on current data. I’m just trying to exclude the half with the worst numbers. After applying these filters, my list shrank to 148 stocks. The next step involves sorting the list by each of the above ratios from best to worst. I sort the list in ascending order for EV to EBIT, Net Debt to EV and Volatility and in descending order for Interest Cover, ROCE and CROCI. I give a rating between 1 and 148 to each stock for each sort, with the highest number (148) corresponding to the best figure and the lowest number (1) to the worst. Finally, I sum the six ratings for each stock and sort the final figures in descending order. My final list with the Top 15 ratings is shown below.
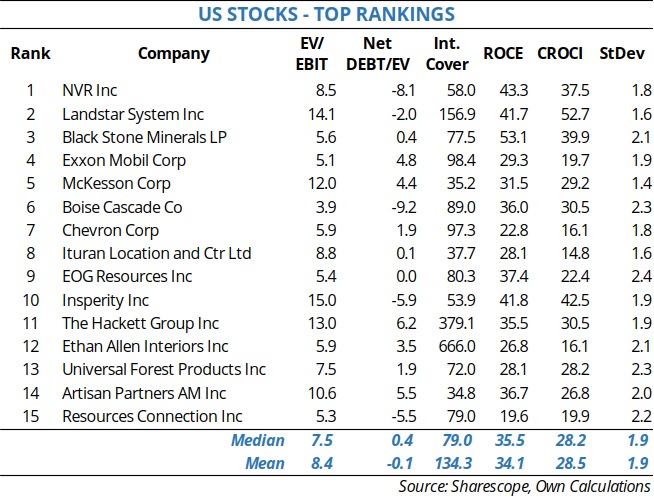
The list has four companies inside the Energy industry: Black Stone Minerals, Exxon Mobil, Chevron and EOG Resources. The tech industry has just one – The Hackett Group. Even when expanding to the full selection list with 148 stocks, there are only a few tech stocks. For those interested, the better-positioned include Texas Instruments and Qalcomm.
Final words
At times everyone is bold, it pays to be more conservative. The stock market is rising too fast, in particular inside the tech megacaps spectrum. To deal with high interest rates and inflation above the central bank’s targets, it’s best to focus on investing in companies with conservative prices and low debt. If you wish, you can build your own portfolio relatively easily using a few filters. In the above case I focused on US stocks, but you can adapt to UK or European stocks.
For relative newbies like me, some basic information about where to obtain the data used in this article in a format suitable for easy importation into Excel would be helpful.