Chart of the Day: HSBC

Rather infuriatingly for bears of the banking sector, it would appear that good news is great news (in share price terms) and bad news is good news. So being short of the key protagonists is a difficult affair. This has been illustrated in the wake of the latest update from HSBC.
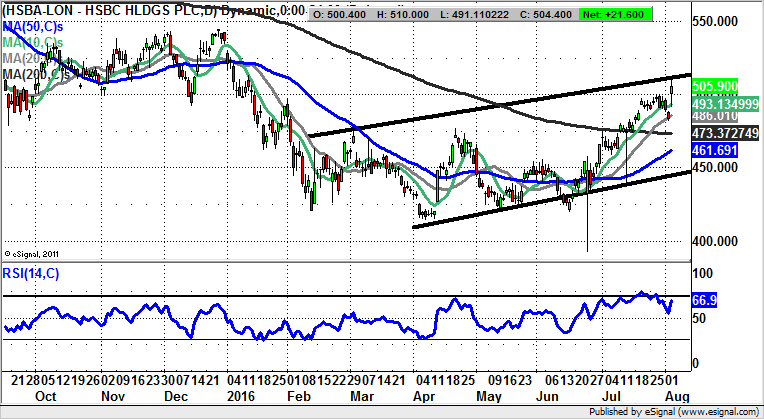
HSBC Holdings (HSBA): Key 510p Resistance
What can be seen on the daily chart of HSBC in recent months is a stock which is clearly attempting to build a base towards the 450p zone. The fact that the company has buttered up shareholders with a $2.5bn buyback, as well as abandoning the 10% return on equity, is something which, ironically, may finally allow the stock to press ahead as the previous uncertainties are out of the way. All of this is illustrated by the way the shares have headed up to a major resistance line from February at the top of a rising trend channel at 510p. While there may be an obvious pause around this number initially, the overall message is that as little as an end of day close above the 2016 resistance line could lead to a decent leg to the upside back towards the former December intraday peak at 544p. The timeframe on such a move could be as soon as one month after any 510p clearance. At this stage only back below the 200 day moving average at 473p is seen as being outright bearish for HSBC, given how smoothly this feature was conquered last month.

Comments (0)